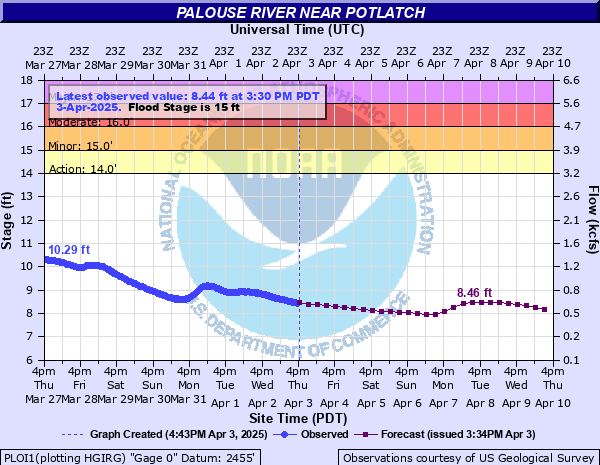
Palouse River near Potlatch
Critical Stages
14' - Action
15' - Flood
16' - Moderate
17' - Major
Latest Observation
Updated: 11:30 AM PST 12/15/25
Status: No Flooding
Stage: 6.48 ft
Flow: 0.152 kcfs
Forecast
| Time | Stage (ft) | Flow (kcfs) |
|---|---|---|
| 4 PM 12/15 | 6.47 | 0.151 |
| 10 PM 12/15 | 6.83 | 0.217 |
| 4 AM 12/16 | 7.44 | 0.343 |
| 10 AM 12/16 | 7.66 | 0.399 |
| 4 PM 12/16 | 7.51 | 0.36 |
| 10 PM 12/16 | 7.18 | 0.285 |
| 4 AM 12/17 | 7.05 | 0.259 |
| 10 AM 12/17 | 7.37 | 0.327 |
| 4 PM 12/17 | 8.15 | 0.542 |
| 10 PM 12/17 | 8.35 | 0.605 |
| 4 AM 12/18 | 8.11 | 0.53 |
| 10 AM 12/18 | 7.71 | 0.413 |
| 4 PM 12/18 | 7.33 | 0.318 |
| 10 PM 12/18 | 7.36 | 0.325 |
| 4 AM 12/19 | 8.1 | 0.527 |
| 10 AM 12/19 | 9.15 | 0.877 |
| 4 PM 12/19 | 9.98 | 1.19 |
| 10 PM 12/19 | 10.22 | 1.29 |
| 4 AM 12/20 | 10.09 | 1.24 |
| 10 AM 12/20 | 9.69 | 1.08 |
| 4 PM 12/20 | 9.19 | 0.892 |
| 10 PM 12/20 | 8.71 | 0.725 |
| 4 AM 12/21 | 8.38 | 0.615 |
| 10 AM 12/21 | 8.12 | 0.533 |
| 4 PM 12/21 | 7.88 | 0.462 |
| 10 PM 12/21 | 7.67 | 0.402 |
| 4 AM 12/22 | 7.57 | 0.374 |
| 10 AM 12/22 | 7.64 | 0.393 |
| 4 PM 12/22 | 7.82 | 0.445 |
| 10 PM 12/22 | 7.94 | 0.479 |
| 4 AM 12/23 | 7.99 | 0.494 |
| 10 AM 12/23 | 8 | 0.497 |
| 4 PM 12/23 | 7.99 | 0.494 |
| 10 PM 12/23 | 7.94 | 0.479 |
| 4 AM 12/24 | 7.93 | 0.476 |
| 10 AM 12/24 | 7.99 | 0.494 |
| 4 PM 12/24 | 8.13 | 0.536 |
| 10 PM 12/24 | 8.24 | 0.57 |
| 4 AM 12/25 | 8.33 | 0.599 |
| Time | Stage (ft) | Flow (kcfs) |
|---|---|---|
| 11:30 AM 12/15 | 6.48 | 0.152 |
| 10:45 AM 12/15 | 6.48 | 0.152 |
| 10:30 AM 12/15 | 6.49 | 0.154 |
| 9:45 AM 12/15 | 6.49 | 0.154 |
| 9:30 AM 12/15 | 6.49 | 0.154 |
| 8:45 AM 12/15 | 6.5 | 0.156 |
| 8:30 AM 12/15 | 6.5 | 0.156 |
| 7:45 AM 12/15 | 6.51 | 0.157 |
| 7:30 AM 12/15 | 6.51 | 0.157 |
| 6:30 AM 12/15 | 6.53 | 0.161 |
| 5:45 AM 12/15 | 6.54 | 0.163 |
| 5:30 AM 12/15 | 6.54 | 0.163 |
| 4:30 AM 12/15 | 6.55 | 0.164 |
| 3:45 AM 12/15 | 6.57 | 0.168 |
| 3:30 AM 12/15 | 6.57 | 0.168 |
| 2:30 AM 12/15 | 6.59 | 0.171 |
| 1:30 AM 12/15 | 6.61 | 0.175 |
| 12:45 AM 12/15 | 6.62 | 0.177 |
| 12:30 AM 12/15 | 6.62 | 0.177 |
| 11:30 PM 12/14 | 6.64 | 0.18 |
| 10:45 PM 12/14 | 6.65 | 0.182 |
| 10:30 PM 12/14 | 6.66 | 0.184 |
| 9:30 PM 12/14 | 6.67 | 0.186 |
| 8:45 PM 12/14 | 6.69 | 0.19 |
| 8:30 PM 12/14 | 6.69 | 0.19 |
| 7:30 PM 12/14 | 6.72 | 0.196 |
| 6:45 PM 12/14 | 6.73 | 0.198 |
| 6:30 PM 12/14 | 6.74 | 0.2 |
| 5:45 PM 12/14 | 6.75 | 0.202 |
| 5:30 PM 12/14 | 6.76 | 0.204 |
22' -
Equivalent to the February 1996 flood. Flooding of homes and businesses on Main Street in Palouse, WA can be expected, several feet deep in some areas. Flood waters will be about 5 feet deep in Hayton Green Park in Palouse, WA. Riverfront homes on Almota Road and Shady Lane near downtown in Palouse, WA may also be flooded. Low-lying homes near the river in Potlatch, ID are likely to be flooded.
19' -
Major widespread flooding between Potlatch Idaho and Palouse Washington can be expected.
18' -
Flooding on the properties near the river along Main Street in the city of Palouse, including several residences near the Lions Club Park.
17.5' -
Water will be over Flannigan Creek Road and in Potlatch Tree Farm in Potlatch Idaho.
17.2' -
Basement flooding in buildings along the river in downtown Palouse. Water increasing around homes near Hayton Green Park in Palouse. Extensive field flooding between Palouse and Potlatch with inundation on Glenwood Road, Wellesley Road, and S River Road. Flooding similar to February 2025.
17' -
Widespread extensive lowland and field flooding between Potlatch Junction Idaho and Palouse Washington, including near portions of Highway 272 near Palouse, and west to Tidwell Road and Highway 27.
16.5' -
Water will be up to the back door at the city shop in Palouse. Water will approach the home on Main Street near Hayton Greene Park. Lions Club Park in Palouse will be submerged and water will be around the playground at the Hayton Greene Park.
15' -
Minor flooding of the low lying areas between Potlatch Idaho and Palouse Washington will occur. Flooding will begin at the Lions Club Community Park and Hayton Greene Park in Palouse. South River Road will likely be flooded where it crosses the Palouse River at Wellesley Rd. The Potlatch softball and baseball fields will see ponding of water.
| Date | Stage (ft) |
|---|---|
| Feb 9, 1996 | 22.15 |
| Jan 16, 1974 | 21.08 |
| Jun 14, 2022 | 18.74 |
| Jan 1, 1997 | 18.32 |
| Feb 19, 1982 | 18.32 |
| Jan 21, 1972 | 18.29 |
| Feb 20, 1968 | 18.08 |
| Mar 31, 2012 | 17.74 |
| Mar 16, 2017 | 17.53 |
| Feb 17, 1981 | 17.31 |
| Feb 24, 2025 | 17.25 |
| Jun 2, 1990 | 17.2 |
| Apr 10, 2019 | 16.93 |
| Mar 27, 2012 | 16.64 |
| Jan 17, 2011 | 16.5 |
| Feb 17, 1970 | 16.4 |
| Feb 20, 1995 | 16.36 |
| Feb 24, 2002 | 16.31 |
| Feb 1, 2003 | 16.1 |
| Feb 5, 2018 | 15.92 |
Data provided by the National Weather Service.