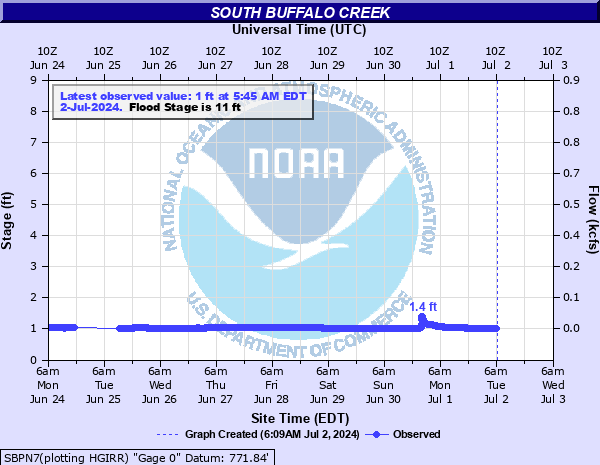
South Buffalo Creek near Pomona
Critical Stages
9' - Action
11' - Flood
14' - Moderate
16' - Major
Latest Observation
Updated: 12:15 AM EST 12/15/25
Status: No Flooding
Stage: 0.95 ft
Flow: 0.0043 kcfs
Forecast
Forecast not available for this location.
| Time | Stage (ft) | Flow (kcfs) |
|---|---|---|
| 12:30 AM 12/15 | 0.95 | 0.0043 |
| 12:25 AM 12/15 | 0.96 | 0.0053 |
| 12:20 AM 12/15 | 0.95 | 0.0043 |
| 12:15 AM 12/15 | 0.95 | 0.0043 |
| 12:10 AM 12/15 | 0.95 | 0.0043 |
| 12:05 AM 12/15 | 0.96 | 0.0053 |
| 12:00 AM 12/15 | 0.95 | 0.0043 |
| 11:55 PM 12/14 | 0.95 | 0.0043 |
| 11:50 PM 12/14 | 0.96 | 0.0053 |
| 11:45 PM 12/14 | 0.96 | 0.0053 |
| 11:40 PM 12/14 | 0.96 | 0.0053 |
| 11:35 PM 12/14 | 0.96 | 0.0053 |
| 11:30 PM 12/14 | 0.96 | 0.0053 |
| 11:25 PM 12/14 | 0.95 | 0.0043 |
| 11:20 PM 12/14 | 0.96 | 0.0053 |
| 11:15 PM 12/14 | 0.96 | 0.0053 |
| 11:10 PM 12/14 | 0.95 | 0.0043 |
| 11:05 PM 12/14 | 0.95 | 0.0043 |
| 11:00 PM 12/14 | 0.96 | 0.0053 |
| 10:55 PM 12/14 | 0.96 | 0.0053 |
| 10:50 PM 12/14 | 0.96 | 0.0053 |
| 10:45 PM 12/14 | 0.96 | 0.0053 |
| 10:40 PM 12/14 | 0.96 | 0.0053 |
| 10:35 PM 12/14 | 0.96 | 0.0053 |
| 10:30 PM 12/14 | 0.96 | 0.0053 |
| 10:25 PM 12/14 | 0.96 | 0.0053 |
| 10:20 PM 12/14 | 0.96 | 0.0053 |
| 10:15 PM 12/14 | 0.96 | 0.0053 |
| 10:10 PM 12/14 | 0.96 | 0.0053 |
| 10:05 PM 12/14 | 0.96 | 0.0053 |
16' -
Major flooding begins. Flooding will reach the lower floor of the Ashley Park Apartments, and access to the apartments via Maplewood Dr. is blocked. Flooding can be expected to impede traffic on Merritt St, Holden Rd, and High Point Rd. Flooding will threat homes along Carrington St., Talley St., and Stokes St. where evacuations may be needed.
14' -
Moderate flooding begins. Water will reach the road surface at Merritt Dr. Flooding will threaten Maplewood Dr. access to the Ashley Creek Apartments.
11' -
Minor flooding begins in areas immediately adjacent to the creek.
9' -
Action stage. The creek is at bankfull and water will reach the top opening of the culvert under Merritt St.
| Date | Stage (ft) |
|---|---|
| Sep 13, 2023 | 15.47 |
| Sep 23, 2003 | 14.77 |
| Sep 17, 2018 | 14.64 |
| Aug 10, 2024 | 14.46 |
| Sep 15, 2000 | 14.01 |
| Oct 11, 2018 | 12.47 |
| Aug 26, 1999 | 7.68 |
| Sep 24, 2001 | 7.37 |
Data provided by the National Weather Service.