« Back to Porters Falls Rivers
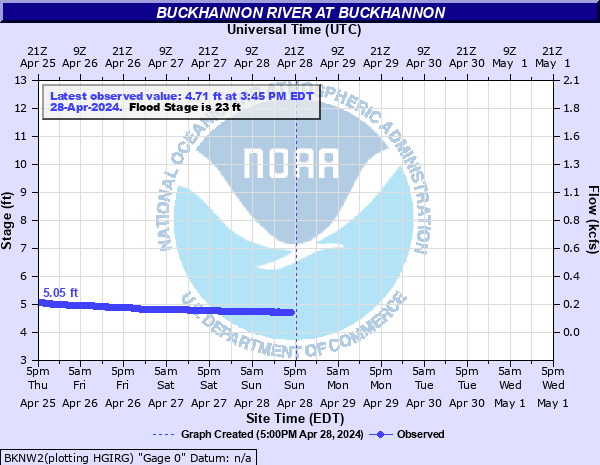
Buckhannon River at Buckhannon
Critical Stages
21' - Action
23' - Flood
25' - Moderate
26' - Major
Latest Observation
Updated: 4:45 AM EST 12/13/25
Status: No Flooding
Stage: 5.32 ft
Flow: 0.238 kcfs
Forecast
Forecast not available for this location.
| Time | Stage (ft) | Flow (kcfs) |
|---|---|---|
| 5:45 AM 12/13 | 5.32 | 0.238 |
| 5:30 AM 12/13 | 5.32 | 0.238 |
| 5:15 AM 12/13 | 5.32 | 0.238 |
| 5:00 AM 12/13 | 5.32 | 0.238 |
| 4:45 AM 12/13 | 5.32 | 0.238 |
| 4:30 AM 12/13 | 5.32 | 0.238 |
| 4:15 AM 12/13 | 5.32 | 0.238 |
| 4:00 AM 12/13 | 5.32 | 0.238 |
| 3:45 AM 12/13 | 5.32 | 0.238 |
| 3:30 AM 12/13 | 5.32 | 0.238 |
| 3:15 AM 12/13 | 5.32 | 0.238 |
| 3:00 AM 12/13 | 5.32 | 0.238 |
| 2:45 AM 12/13 | 5.32 | 0.238 |
| 2:30 AM 12/13 | 5.32 | 0.238 |
| 2:15 AM 12/13 | 5.33 | 0.239 |
| 2:00 AM 12/13 | 5.33 | 0.239 |
| 1:45 AM 12/13 | 5.32 | 0.238 |
| 1:30 AM 12/13 | 5.33 | 0.239 |
| 1:15 AM 12/13 | 5.33 | 0.239 |
| 1:00 AM 12/13 | 5.33 | 0.239 |
| 12:45 AM 12/13 | 5.33 | 0.239 |
| 12:30 AM 12/13 | 5.33 | 0.239 |
| 12:15 AM 12/13 | 5.33 | 0.239 |
| 12:00 AM 12/13 | 5.33 | 0.239 |
| 11:45 PM 12/12 | 5.33 | 0.239 |
| 11:30 PM 12/12 | 5.33 | 0.239 |
| 11:15 PM 12/12 | 5.33 | 0.239 |
| 11:00 PM 12/12 | 5.33 | 0.239 |
| 10:45 PM 12/12 | 5.33 | 0.239 |
| 10:30 PM 12/12 | 5.33 | 0.239 |
26' -
Major flooding in Buckhannon and surrounding areas. Business/factory across from the Hall Rd bridge near the gage begins to flood.
25' -
Several streets, homes, and businesses along the river flood.
24' -
Portions of Cleveland Ave and Wood St flood. Sections of Rte 20 south and north of town begin to flood.
23' -
Portions of River Rd, Vicksburg Rd, and the intersection of Madison St and Florida St floods. Portions of Norvell Dr flood due to backwater. Some homes and low lying areas in and around Buckhannon adjacent to small streams also flood due to backwater.
| Date | Stage (ft) |
|---|---|
| Nov 5, 1985 | 30.2 |
| Feb 9, 1994 | 28.32 |
| Jul 31, 1996 | 27.85 |
| Feb 19, 2000 | 26.22 |
| Mar 5, 2015 | 25.95 |
| Jul 28, 1992 | 25.92 |
| May 7, 1994 | 25.7 |
| May 17, 1996 | 25.4 |
| Apr 16, 2018 | 25.33 |
| Feb 1, 2025 | 25.15 |
| Feb 23, 2003 | 25.13 |
| Feb 7, 2004 | 25.09 |
| May 8, 2022 | 24.78 |
| Feb 7, 2025 | 24.27 |
| Mar 2, 1997 | 24.2 |
| Nov 20, 2003 | 24.12 |
| Dec 7, 2013 | 24.08 |
| Nov 20, 2003 | 24.03 |
| Jan 7, 1994 | 24 |
| Feb 17, 2018 | 23.74 |
Data provided by the National Weather Service.