South Fork Stillaguamish River near Granite Falls
Critical Stages
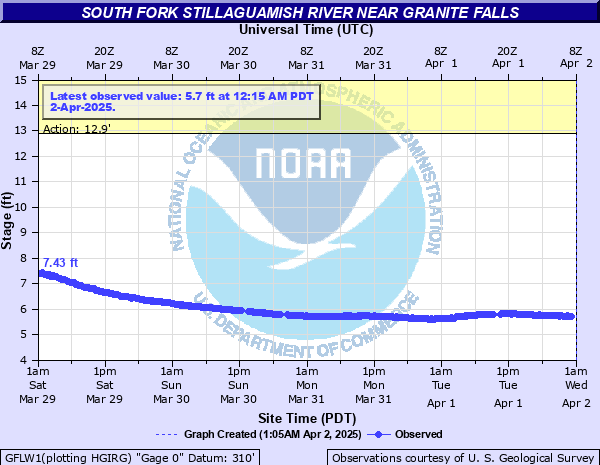
12.9' - Action
Flood
Moderate
Major
Latest Observation
Updated: 9:15 AM PST 12/6/25
Status: No Flooding
Stage: 9.49 ft
Flow: 7.26 kcfs
Forecast
Forecast not available for this location.
| Time | Stage (ft) | Flow (kcfs) |
|---|---|---|
| 9:15 AM 12/6 | 9.49 | 7.26 |
| 9:00 AM 12/6 | 9.51 | 7.3 |
| 8:45 AM 12/6 | 9.6 | 7.48 |
| 8:30 AM 12/6 | 9.6 | 7.48 |
| 8:15 AM 12/6 | 9.75 | 7.78 |
| 8:00 AM 12/6 | 9.86 | 8.01 |
| 7:45 AM 12/6 | 9.9 | 8.1 |
| 7:30 AM 12/6 | 9.99 | 8.28 |
| 7:15 AM 12/6 | 9.95 | 8.2 |
| 7:00 AM 12/6 | 10.08 | 8.47 |
| 6:45 AM 12/6 | 10.08 | 8.47 |
| 6:30 AM 12/6 | 10.14 | 8.59 |
| 6:15 AM 12/6 | 10.17 | 8.66 |
| 6:00 AM 12/6 | 10.19 | 8.7 |
| 5:45 AM 12/6 | 10.27 | 8.88 |
| 5:30 AM 12/6 | 10.26 | 8.86 |
| 5:15 AM 12/6 | 10.28 | 8.9 |
| 5:00 AM 12/6 | 10.25 | 8.84 |
| 4:45 AM 12/6 | 10.23 | 8.79 |
| 4:30 AM 12/6 | 10.31 | 8.97 |
| 4:15 AM 12/6 | 10.25 | 8.84 |
| 4:00 AM 12/6 | 10.18 | 8.68 |
| 3:45 AM 12/6 | 10.08 | 8.47 |
| 3:30 AM 12/6 | 10.01 | 8.32 |
| 3:15 AM 12/6 | 10 | 8.3 |
| 3:00 AM 12/6 | 9.94 | 8.18 |
| 2:45 AM 12/6 | 9.77 | 7.83 |
| 2:30 AM 12/6 | 9.62 | 7.51 |
| 2:15 AM 12/6 | 9.47 | 7.22 |
| 2:00 AM 12/6 | 9.43 | 7.15 |
18' -
the South Fork Stillaguamish River will cause flooding of Jordan Road...the Robe Valley area upstream from Granite Falls...and Granite Falls downstream to the Blue Spruce area. Flooding will occur all along the river including headwaters...tributaries...and other streams within and near the South Fork Stillaguamish River Basin. A stage of 18 feet corresponds to Phase 4 in the Snohomish County Flood Warning System.
16' -
the South Fork Stillaguamish River will cause flooding in Granite Falls downstream to the Blue Spruce area and Jordan Road. A stage of 16 feet corresponds to Phase 3 in the Snohomish County Flood Warning System.
14' -
the South Fork Stillaguamish River will cause flooding along the river and tributaries. A stage of 14 feet corresponds to Phase 2 in the Snohomish County Flood Warning System.
| Date | Stage (ft) |
|---|---|
| Nov 6, 2006 | 22.82 |
| Oct 20, 2003 | 21.17 |
| Nov 17, 2015 | 20.35 |
| Feb 26, 1932 | 19.7 |
| Dec 12, 2010 | 18.5 |
| Feb 9, 1951 | 18.1 |
| Nov 13, 2015 | 17.66 |
| Dec 5, 2023 | 17.55 |
| Feb 1, 2020 | 17.41 |
| Jan 8, 2009 | 17.26 |
| Dec 9, 1956 | 17.22 |
| Dec 15, 1959 | 17.17 |
| Jan 24, 1935 | 16.99 |
| Nov 22, 2017 | 16.82 |
| Dec 2, 1975 | 16.71 |
| Nov 22, 1959 | 16.5 |
| Dec 11, 2004 | 16.44 |
| Nov 13, 1932 | 16.37 |
| Nov 19, 2003 | 16.32 |
| Oct 25, 1946 | 16.3 |
Data provided by the National Weather Service.