« Back to Ranchette Estates Rivers
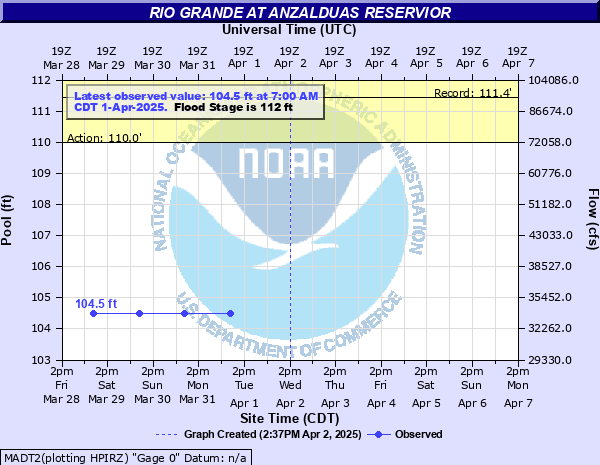
Rio Grande at Anzalduas Reservior
Critical Stages
110' - Action
112' - Flood
116' - Moderate
121' - Major
Latest Observation
Updated: 6:09 PM LMT 12/31/00
Status: Obs Not Current
Stage: -999 ft
Flow: -999 kcfs
Forecast
Forecast not available for this location.
| Time | Stage (ft) | Flow (kcfs) |
|---|---|---|
| 6:00 AM 12/15 | 101.31 | 25.8 |
| 6:00 AM 12/14 | 101.49 | 26.1 |
| 6:00 AM 12/13 | 101.74 | 26.7 |
| 6:00 AM 12/12 | 101.39 | 25.9 |
| 6:00 AM 12/11 | 101 | 25.2 |
| 6:00 AM 12/10 | 100.79 | 24.8 |
| 6:00 AM 12/9 | 100.71 | 24.6 |
| 6:00 AM 12/8 | 100.74 | 24.7 |
| 6:00 AM 12/7 | 101.17 | 25.5 |
| 6:00 AM 12/6 | 101.18 | 25.5 |
| 6:00 AM 12/5 | 101.32 | 25.8 |
| 6:00 AM 12/4 | 101.37 | 25.9 |
| 6:00 AM 12/3 | 101.4 | 26 |
| 6:00 AM 12/2 | 101.36 | 25.9 |
| 6:00 AM 12/1 | 102.62 | 28.5 |
| 6:00 AM 11/30 | 101.94 | 27.1 |
| 6:00 AM 11/29 | 102 | 27.2 |
| 6:00 AM 11/28 | 102.14 | 27.5 |
| 6:00 AM 11/27 | 102.26 | 27.7 |
| 6:00 AM 11/26 | 102 | 27.2 |
| 6:00 AM 11/25 | 102.1 | 27.4 |
| 6:00 AM 11/24 | 102.2 | 27.6 |
| 6:00 AM 11/23 | 102.49 | 28.2 |
| 6:00 AM 11/22 | 102.89 | 29.1 |
| 6:00 AM 11/21 | 103.12 | 29.7 |
| 6:00 AM 11/20 | 103.27 | 30.1 |
| 6:00 AM 11/19 | 103.1 | 29.6 |
| 6:00 AM 11/18 | 103.13 | 29.7 |
| 6:00 AM 11/17 | 103.17 | 29.8 |
| 6:00 AM 11/16 | 102.94 | 29.2 |
104' -
Major flooding inside the levees - all irrigation pumps, livestock, and equipment should be removed from inside the Rio Grande river levees below Anzalduas Dam to below Retamal Dam
99' -
Moderate lowland flooding will cover much of the Rio Grande river flood plain inside the levees - irrigation pumps and equipment should be removed immediately from banks below Anzalduas Dam to below Retamal Dam
95' -
Minor lowland flooding will exceed the Rio Grande river banks in low sections inside the levees - livestock and pumps should be removed from the lowest flood prone areas
| Date | Stage (ft) |
|---|---|
| Jul 20, 2010 | 111.44 |
| Oct 15, 1971 | 108.27 |
| Sep 23, 1971 | 107.97 |
| Aug 27, 1976 | 104.79 |
| Sep 20, 1988 | 103.81 |
| Jun 27, 1973 | 102.69 |
| Jul 1, 1973 | 102.4 |
| Sep 1, 1976 | 99.87 |
| Oct 1, 1978 | 99.48 |
| Sep 27, 1978 | 99.21 |
| Sep 28, 1973 | 98.62 |
| Oct 14, 1973 | 97.47 |
| May 16, 1985 | 97.11 |
| Apr 11, 1954 | 97.11 |
| Jul 26, 1975 | 96.46 |
| Oct 2, 1976 | 96.19 |
| Sep 12, 1975 | 96.06 |
| Aug 21, 1975 | 96.06 |
| Feb 22, 1983 | 95.7 |
| Oct 2, 1974 | 95.47 |
Data provided by the National Weather Service.