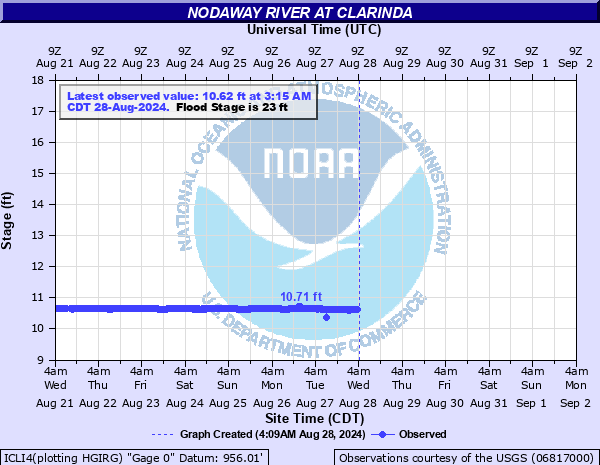
Nodaway River at Clarinda
Critical Stages
21' - Action
23' - Flood
26' - Moderate
29' - Major
Latest Observation
Updated: 2:15 PM CST 12/15/25
Status: No Flooding
Stage: 10.58 ft
Flow: 0.0116 kcfs
Forecast
Forecast not available for this location.
| Time | Stage (ft) | Flow (kcfs) |
|---|---|---|
| 2:15 PM 12/15 | 10.58 | 0.0116 |
| 2:00 PM 12/15 | 10.58 | 0.0116 |
| 1:45 PM 12/15 | 10.58 | 0.0116 |
| 1:30 PM 12/15 | 10.58 | 0.0116 |
| 1:15 PM 12/15 | 10.58 | 0.0116 |
| 1:00 PM 12/15 | 10.59 | 0.025 |
| 12:45 PM 12/15 | 10.59 | 0.025 |
| 12:30 PM 12/15 | 10.59 | 0.025 |
| 12:15 PM 12/15 | 10.59 | 0.025 |
| 12:00 PM 12/15 | 10.6 | 0.066 |
| 11:45 AM 12/15 | 10.6 | 0.066 |
| 11:30 AM 12/15 | 10.6 | 0.066 |
| 11:15 AM 12/15 | 10.6 | 0.066 |
| 11:00 AM 12/15 | 10.6 | 0.066 |
| 10:45 AM 12/15 | 10.6 | 0.066 |
| 10:30 AM 12/15 | 10.6 | 0.066 |
| 10:15 AM 12/15 | 10.6 | 0.066 |
| 10:00 AM 12/15 | 10.6 | 0.066 |
| 9:45 AM 12/15 | 10.6 | 0.066 |
| 9:30 AM 12/15 | 10.6 | 0.066 |
| 9:15 AM 12/15 | 10.59 | 0.025 |
| 9:00 AM 12/15 | 10.59 | 0.025 |
| 8:45 AM 12/15 | 10.59 | 0.025 |
| 8:30 AM 12/15 | 10.59 | 0.025 |
| 8:15 AM 12/15 | 10.59 | 0.025 |
| 8:00 AM 12/15 | 10.59 | 0.025 |
| 7:45 AM 12/15 | 10.59 | 0.025 |
| 7:30 AM 12/15 | 10.59 | 0.025 |
| 7:15 AM 12/15 | 10.59 | 0.025 |
| 7:00 AM 12/15 | 10.59 | 0.025 |
31' -
Commerical areas near the river in the northeast part of town begin to flood.
29' -
The town of Clarinda is well outside the floodplain, even at this level. However, floodwaters begin to encroach on buildings east of North First Street. In addition, floodwaters may begin to impact the city lagoons.
26' -
Several residences located on the outskirts of town may begin to be threatened by floodwaters.
23' -
T Avenue northeast of Clarinda begins to flood or is very close to flooding. County roads near the river are flooded. Clarinda itself is well outside the floodplain and is not directly impacted.
22' -
Though the majority of the river remains contained in the channel, some overflow begins north of Washington Street and even more so northeast of Clarinda. Despite this overflow, no significant impacts are occurring.
18.5' -
At this level, the dam will be submerged and channel control will exist.
10.5' -
This is the gage height of the top of the low-head dam located 500 feet downstream of the gage.
| Date | Stage (ft) |
|---|---|
| May 24, 2019 | 26.7 |
| Jun 5, 2008 | 26.61 |
| Mar 14, 2019 | 26.47 |
Data provided by the National Weather Service.