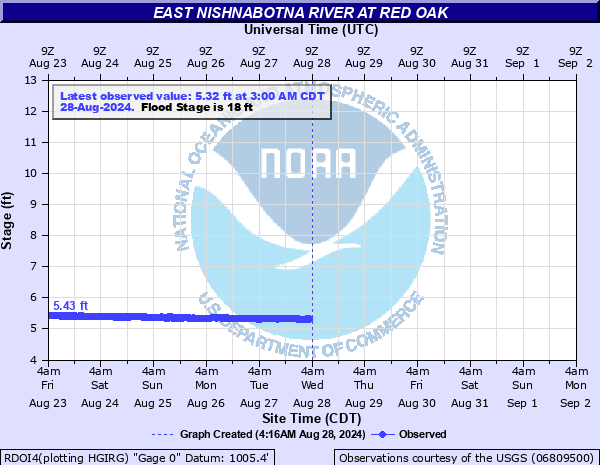
East Nishnabotna River at Red Oak
Critical Stages
16' - Action
18' - Flood
22' - Moderate
27' - Major
Latest Observation
Updated: 2:00 PM CST 12/15/25
Status: No Flooding
Stage: 6.09 ft
Flow: 0.269 kcfs
Forecast
Forecast not available for this location.
| Time | Stage (ft) | Flow (kcfs) |
|---|---|---|
| 2:00 PM 12/15 | 6.09 | 0.269 |
| 1:45 PM 12/15 | 6.04 | 0.254 |
| 1:30 PM 12/15 | 6.09 | 0.269 |
| 1:15 PM 12/15 | 6.06 | 0.26 |
| 1:00 PM 12/15 | 6.08 | 0.266 |
| 12:45 PM 12/15 | 6.1 | 0.272 |
| 12:30 PM 12/15 | 6.07 | 0.263 |
| 12:15 PM 12/15 | 6.09 | 0.269 |
| 12:00 PM 12/15 | 6.04 | 0.254 |
| 11:45 AM 12/15 | 6.06 | 0.26 |
| 11:30 AM 12/15 | 6.05 | 0.257 |
| 11:15 AM 12/15 | 6.05 | 0.257 |
| 11:00 AM 12/15 | 6.02 | 0.248 |
| 10:45 AM 12/15 | 6.04 | 0.254 |
| 10:30 AM 12/15 | 6.05 | 0.257 |
| 10:15 AM 12/15 | 6.04 | 0.254 |
| 10:00 AM 12/15 | 6.03 | 0.251 |
| 9:45 AM 12/15 | 6.03 | 0.251 |
| 9:30 AM 12/15 | 6.02 | 0.248 |
| 9:15 AM 12/15 | 6.05 | 0.257 |
| 9:00 AM 12/15 | 6.04 | 0.254 |
| 8:45 AM 12/15 | 6.03 | 0.251 |
| 8:30 AM 12/15 | 6.04 | 0.254 |
| 8:15 AM 12/15 | 6.06 | 0.26 |
| 8:00 AM 12/15 | 6.06 | 0.26 |
| 7:45 AM 12/15 | 6.05 | 0.257 |
| 7:30 AM 12/15 | 6.06 | 0.26 |
| 7:15 AM 12/15 | 6.06 | 0.26 |
| 7:00 AM 12/15 | 6.1 | 0.272 |
| 6:45 AM 12/15 | 6.08 | 0.266 |
37' -
Water begins to flow over the Coolbaugh Street bridge at the gage site.
36' -
Water nears the top of the federal levee protecting Red Oak.
30' -
Water approaches the bottom of the bridge at Coolbaugh Street.
29.5' -
The airport begins to flood.
28.5' -
West Coolbaugh Street begins to flood.
27' -
200th Street, also known as H34, begins to flood east of the airport.
25' -
Highway 34 west of Broadway Street begins to flood.
22' -
Buildings between G Avenue and the river begin to flood. Also G Avenue is likely closed due to flooding.
20' -
Lowland flooding begins along the west bank.
18' -
Rural lowlands begin to flood along the east bank.
| Date | Stage (ft) |
|---|---|
| Jun 15, 1998 | 29.39 |
| Jun 13, 1947 | 28.23 |
| Sep 13, 1972 | 27.43 |
| Jul 3, 1958 | 27.27 |
| Jun 7, 1917 | 26.3 |
| May 7, 2007 | 26.24 |
| May 23, 1945 | 25.5 |
| Mar 14, 2019 | 24.61 |
| Mar 2, 1965 | 24.4 |
| Jun 13, 2008 | 24.09 |
| Mar 19, 1948 | 23.9 |
| Mar 4, 1937 | 23.6 |
| Jul 20, 1942 | 23.4 |
| Aug 12, 1939 | 23.2 |
| Feb 6, 1946 | 23.2 |
| Aug 2, 1944 | 22.9 |
| Feb 4, 1943 | 22.9 |
| Jun 26, 1924 | 22.8 |
| Mar 5, 1949 | 22.7 |
| Jun 15, 1991 | 22.25 |
Data provided by the National Weather Service.