« Back to Reporting System Rivers
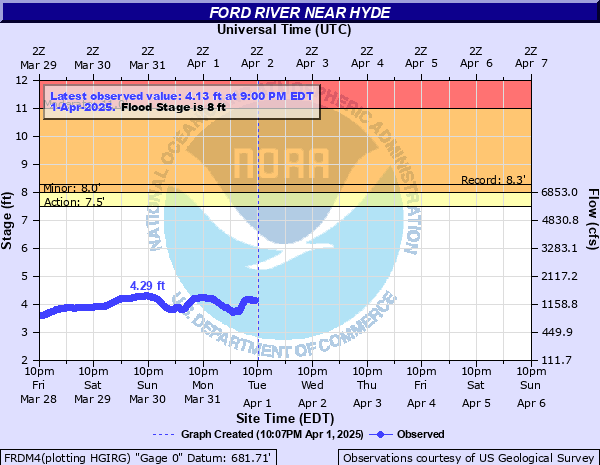
Ford River near Hyde
Critical Stages
7.5' - Action
8' - Flood
11' - Moderate
13' - Major
Latest Observation
Updated: 4:00 AM EST 12/16/25
Status: No Flooding
Stage: 3.22 ft
Flow: 0.592 kcfs
Forecast
Forecast not available for this location.
| Time | Stage (ft) | Flow (kcfs) |
|---|---|---|
| 4:00 AM 12/16 | 3.22 | 0.592 |
| 3:45 AM 12/16 | 3.22 | 0.592 |
| 3:30 AM 12/16 | 3.22 | 0.592 |
| 3:15 AM 12/16 | 3.22 | 0.592 |
| 3:00 AM 12/16 | 3.22 | 0.592 |
| 2:45 AM 12/16 | 3.22 | 0.592 |
| 2:30 AM 12/16 | 3.22 | 0.592 |
| 2:15 AM 12/16 | 3.22 | 0.592 |
| 2:00 AM 12/16 | 3.22 | 0.592 |
| 1:45 AM 12/16 | 3.22 | 0.592 |
| 1:30 AM 12/16 | 3.22 | 0.592 |
| 1:15 AM 12/16 | 3.22 | 0.592 |
| 1:00 AM 12/16 | 3.22 | 0.592 |
| 12:45 AM 12/16 | 3.22 | 0.592 |
| 12:30 AM 12/16 | 3.22 | 0.592 |
| 12:15 AM 12/16 | 3.22 | 0.592 |
| 12:00 AM 12/16 | 3.22 | 0.592 |
| 11:45 PM 12/15 | 3.21 | 0.586 |
| 11:30 PM 12/15 | 3.21 | 0.586 |
| 11:15 PM 12/15 | 3.21 | 0.586 |
| 11:00 PM 12/15 | 3.21 | 0.586 |
| 10:45 PM 12/15 | 3.21 | 0.586 |
| 10:30 PM 12/15 | 3.21 | 0.586 |
| 10:15 PM 12/15 | 3.21 | 0.586 |
| 10:00 PM 12/15 | 3.2 | 0.58 |
| 9:45 PM 12/15 | 3.2 | 0.58 |
| 9:30 PM 12/15 | 3.2 | 0.58 |
| 9:15 PM 12/15 | 3.2 | 0.58 |
| 9:00 PM 12/15 | 3.2 | 0.58 |
| 8:45 PM 12/15 | 3.2 | 0.58 |
10.8' -
Water reaches the bottom of County Road 533 bridge
8' -
River floods low lying areas along the left bank upstream and downstream of County Road 533 bridge
6' -
River overflows the left bank upstream and downstream of County Road 533 bridge
| Date | Stage (ft) |
|---|---|
| May 7, 1960 | 8.27 |
| Apr 26, 1996 | 7.45 |
| Apr 11, 2014 | 7.22 |
| Apr 14, 1971 | 7.09 |
| Apr 4, 1986 | 6.97 |
| Apr 26, 1979 | 6.84 |
| May 2, 1972 | 6.79 |
| Apr 18, 2019 | 6.62 |
| Apr 25, 1975 | 6.61 |
| Apr 17, 2023 | 6.58 |
| Apr 7, 1997 | 6.49 |
| Apr 2, 2020 | 6.44 |
| Apr 14, 2022 | 6.29 |
| Apr 5, 1967 | 6.24 |
| Apr 2, 1998 | 6.17 |
| Apr 15, 2002 | 6.17 |
| Apr 9, 1980 | 6.1 |
| Apr 20, 2008 | 6.06 |
| May 31, 1970 | 6.02 |
| Apr 15, 2013 | 6.02 |
Data provided by the National Weather Service.