River Raisin at Blissfield
Critical Stages
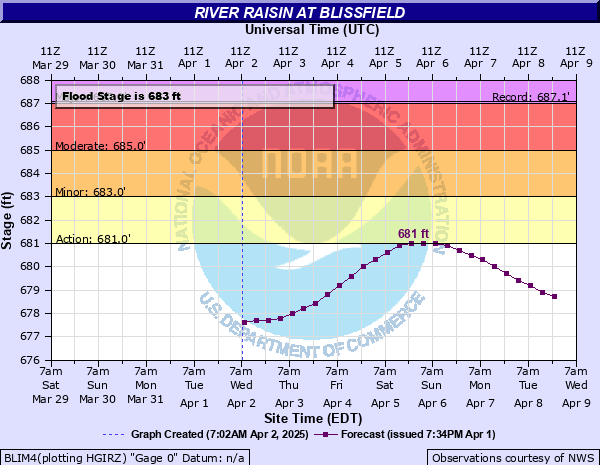
681' - Action
683' - Flood
685' - Moderate
687' - Major
Latest Observation
Updated: 7:03 PM LMT 12/31/00
Status: Obs Not Current
Stage: -999 ft
Flow: -999 kcfs
Forecast
Forecast not available for this location.
Observation history not available.
687.5' -
River Street floods.
687.1' -
The flood of record set on February 20, 1981 is reached.
687' -
Homes and businesses located near the river and on the west side of the village are inudated, forcing evacuation of many residents.
685.6' -
Water begins to hit the bottom of the U.S. 223 bridge, and will dam up on the upstream side if the river continues to rise.
683' -
Ellis Park begins to flood.
682' -
The river reaches bankfull.
| Date | Stage (ft) |
|---|---|
| Feb 20, 1981 | 687.1 |
| Jun 29, 2015 | 685.9 |
| Dec 1, 2011 | 685.62 |
| Mar 12, 2009 | 685.4 |
| Feb 8, 2008 | 685.1 |
| Feb 22, 2018 | 684.19 |
| Jul 5, 2008 | 684.12 |
| Feb 20, 1998 | 684.1 |
| Jan 25, 2000 | 684 |
| Apr 29, 2011 | 683.98 |
| May 20, 2020 | 683.96 |
| May 3, 2019 | 683.8 |
| Jan 11, 2008 | 683.8 |
| Jan 15, 2005 | 683.65 |
| May 13, 2002 | 683.5 |
| Jun 20, 1996 | 683.5 |
| Jan 13, 2020 | 683.46 |
| Feb 13, 2009 | 683.22 |
| Feb 11, 2001 | 683.2 |
| Mar 1, 2023 | 683.1 |
Data provided by the National Weather Service.