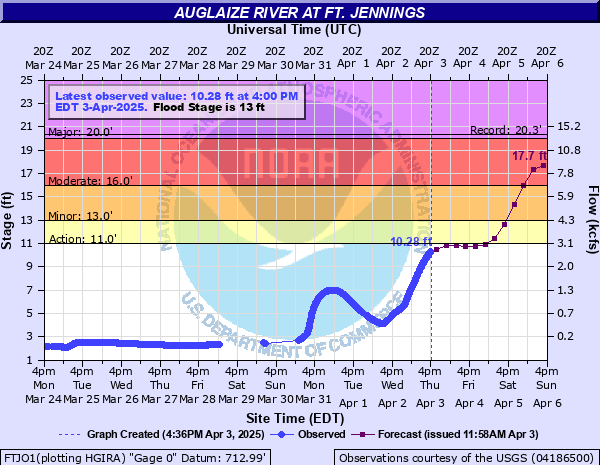
Auglaize River at Ft. Jennings
Critical Stages
11' - Action
13' - Flood
16' - Moderate
20' - Major
Latest Observation
Updated: 2:00 AM EST 12/5/25
Status: No Flooding
Stage: 1.89 ft
Flow: 0.0291 kcfs
Forecast
Forecast not available for this location.
| Time | Stage (ft) | Flow (kcfs) |
|---|---|---|
| 2:00 AM 12/5 | 1.89 | 0.0291 |
| 1:45 AM 12/5 | 1.9 | 0.0306 |
| 1:30 AM 12/5 | 1.9 | 0.0306 |
| 1:15 AM 12/5 | 1.9 | 0.0306 |
| 1:00 AM 12/5 | 1.9 | 0.0306 |
| 12:45 AM 12/5 | 1.9 | 0.0306 |
| 12:30 AM 12/5 | 1.9 | 0.0306 |
| 12:15 AM 12/5 | 1.91 | 0.0323 |
| 12:00 AM 12/5 | 1.91 | 0.0323 |
| 11:45 PM 12/4 | 1.91 | 0.0323 |
| 11:30 PM 12/4 | 1.91 | 0.0323 |
| 11:15 PM 12/4 | 1.91 | 0.0323 |
| 11:00 PM 12/4 | 1.91 | 0.0323 |
| 10:45 PM 12/4 | 1.92 | 0.034 |
| 10:30 PM 12/4 | 1.92 | 0.034 |
| 10:15 PM 12/4 | 1.92 | 0.034 |
| 10:00 PM 12/4 | 1.92 | 0.034 |
| 9:45 PM 12/4 | 1.92 | 0.034 |
| 9:30 PM 12/4 | 1.92 | 0.034 |
| 9:15 PM 12/4 | 1.92 | 0.034 |
| 9:00 PM 12/4 | 1.92 | 0.034 |
| 8:45 PM 12/4 | 1.92 | 0.034 |
| 8:30 PM 12/4 | 1.92 | 0.034 |
| 8:15 PM 12/4 | 1.92 | 0.034 |
| 8:00 PM 12/4 | 1.92 | 0.034 |
| 7:45 PM 12/4 | 1.92 | 0.034 |
| 7:30 PM 12/4 | 1.92 | 0.034 |
| 7:15 PM 12/4 | 1.92 | 0.034 |
| 7:00 PM 12/4 | 1.92 | 0.034 |
| 6:45 PM 12/4 | 1.92 | 0.034 |
21.4' -
Flood water begins to hit the bottom of the bridge at the gage site.
20' -
A major flood is in progress. Extensive inundation and damage of property can be expected. Many primary roads and bridges will be closed and numerous evacuations will be necessary.
16' -
Moderate flooding begins along the Auglaize River with secondary roads and agricultural lands as well as homes nearest the river being affected by flood waters. Some evacuations of people and property may be necessary.
13' -
Minor flooding begins in the northwest Ohio counties of northwest Allen, northeast Van Wert, and southwest Putnam. Farm land nearest the Auglaize river will be affected by flood water.
| Date | Stage (ft) |
|---|---|
| Jan 23, 1959 | 20.3 |
| Jul 15, 1992 | 19.76 |
| Feb 7, 2008 | 19.44 |
| Feb 7, 2008 | 19.41 |
| Feb 11, 1959 | 19.07 |
| May 18, 2019 | 18.99 |
| Mar 1, 2011 | 18.95 |
| Jun 17, 2015 | 18.82 |
| Jun 3, 1980 | 18.45 |
| Dec 31, 1990 | 18.18 |
| Jan 19, 1996 | 17.4 |
| Jan 13, 2005 | 17.23 |
| Mar 6, 1963 | 17.2 |
| Feb 24, 1985 | 17.2 |
| Mar 17, 1978 | 17.19 |
| Jan 23, 1999 | 17.03 |
| Mar 21, 1927 | 17 |
| Jun 14, 1981 | 16.8 |
| Jul 4, 1993 | 16.77 |
| Jan 15, 1930 | 16.6 |
Data provided by the National Weather Service.