Clifty Creek near Columbus
Critical Stages
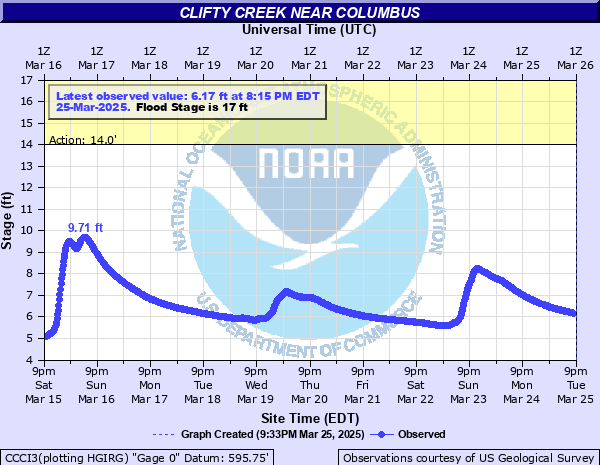
14' - Action
17' - Flood
20' - Moderate
23' - Major
Latest Observation
Updated: 3:15 PM EST 12/6/25
Status: No Flooding
Stage: 5.27 ft
Flow: -999 kcfs
Forecast
Forecast not available for this location.
| Time | Stage (ft) | Flow (kcfs) |
|---|---|---|
| 3:15 PM 12/6 | 5.27 | -999 |
| 3:00 PM 12/6 | 5.27 | -999 |
| 2:45 PM 12/6 | 5.28 | -999 |
| 2:30 PM 12/6 | 5.3 | -999 |
| 2:15 PM 12/6 | 5.27 | -999 |
| 2:00 PM 12/6 | 5.27 | -999 |
| 1:45 PM 12/6 | 5.28 | -999 |
| 1:30 PM 12/6 | 5.28 | -999 |
| 1:15 PM 12/6 | 5.32 | -999 |
| 1:00 PM 12/6 | 5.3 | -999 |
| 12:45 PM 12/6 | 5.26 | -999 |
| 12:30 PM 12/6 | 5.27 | -999 |
| 12:15 PM 12/6 | 5.27 | -999 |
| 12:00 PM 12/6 | 5.26 | -999 |
| 11:45 AM 12/6 | 5.27 | -999 |
| 11:30 AM 12/6 | 5.27 | -999 |
| 11:15 AM 12/6 | 5.27 | -999 |
| 11:00 AM 12/6 | 5.26 | -999 |
| 10:45 AM 12/6 | 5.28 | -999 |
| 10:30 AM 12/6 | 5.28 | -999 |
| 10:15 AM 12/6 | 5.27 | -999 |
| 10:00 AM 12/6 | 5.28 | -999 |
| 9:45 AM 12/6 | 5.27 | -999 |
| 9:30 AM 12/6 | 5.26 | -999 |
| 9:15 AM 12/6 | 5.26 | -999 |
| 9:00 AM 12/6 | 5.25 | -999 |
| 8:45 AM 12/6 | 5.25 | -999 |
| 8:30 AM 12/6 | 5.27 | -999 |
| 8:15 AM 12/6 | 5.28 | -999 |
| 8:00 AM 12/6 | 5.26 | -999 |
23' -
Major flooding in progress along Clifty Creek. Water levels above those of June 2008. US Highway 31 and SR 46 remain open according to Columbus Response Plan.
20' -
Extensive flooding of Clifty Park in the Columbus area. Flooding of homes in Newbern and around Petersville. Sunland Road and Indiana 9 near Newbern remained flooded.
18.5' -
Gladstone Avenue is flooded where it crosses Clifty Creek according to Columbus Response Plan.
9' -
Backwater from East Fork White River will occur at this level and lower when the East Fork White River at Columbus is 10 feet and higher.
| Date | Stage (ft) |
|---|---|
| Jun 7, 2008 | 22.17 |
| Jun 20, 2021 | 21.37 |
| Aug 5, 2009 | 20.54 |
| Apr 6, 2025 | 19.56 |
| Feb 8, 2019 | 19.5 |
| Jul 14, 2015 | 19.16 |
| Apr 4, 2018 | 18.94 |
| Mar 19, 2008 | 18.61 |
| Dec 22, 2013 | 18.34 |
| Jun 17, 2019 | 17.77 |
| Nov 6, 2017 | 17.62 |
| Feb 25, 2018 | 17.51 |
| Mar 21, 2020 | 17.38 |
| Nov 2, 2018 | 17.27 |
| Apr 20, 2011 | 17.18 |
| Jun 22, 2018 | 16.97 |
| Jan 9, 2008 | 16.7 |
| Jan 15, 2007 | 16.68 |
| May 6, 2017 | 16.56 |
| Apr 4, 2014 | 16.54 |
Data provided by the National Weather Service.