Muscatatuck River at Wheeler Hollow
Critical Stages
14.5' - Action
18' - Flood
22.5' - Moderate
28' - Major
Latest Observation
Updated: 7:03 PM LMT 12/31/00
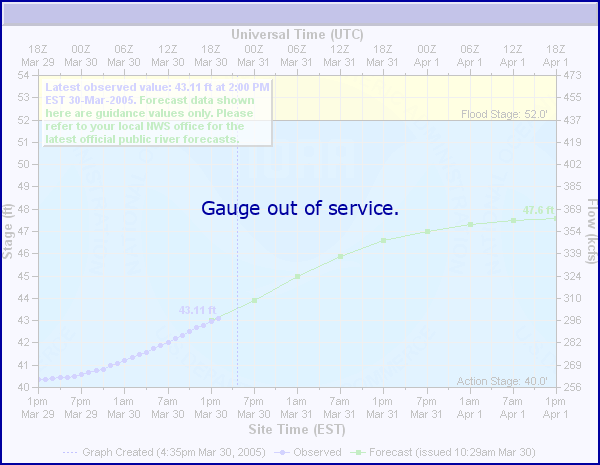
Status: Out Of Service
Stage: -999 ft
Flow: -999 kcfs
Forecast
Forecast not available for this location.
Observation history not available.
28.25' -
This estimated level of the March 2008 flood. This flood is not believed to be the record flood for the Muscatatuck River. These honors go to the February 1959 flood.
28' -
This level is estimated because the gage is underwater. Flooding of this type occurred in January 2005 and March 2008. Impossible to travel to Wheeler Hollow by normal route. People must take high ground route to get out. Water in at least 3 homes during March 2008 and approaching or about to enter several more. At least a few people who flooded in January 2005 relocated to higher ground before March 2008. A few new residents experienced the March 2008 flood.
24.5' -
Top of staff gage. Extensive flooding in progress. Water around several homes. Local roads are flooded extensive. State road 135 likely flooded just north of Milport at this level and higher.
23.5' -
Extensive flooding in progress affecting local residents and closing several local roads. River residents very concerned.
22.5' -
A few residents needed to park vehicles on higher ground so they can get it. A few local roads flood. Water in some residents backyards.
21.7' -
Several driveways in the Wheeler Hollow area were flooded at this level in April 2015.
20' -
High water is noticed along the river. Flood waters in a few backyards. A few roads are flooded.
18' -
Floods area in a few low spots and woodland areas along the river. Residential property is not directly at this point.
16' -
High water begins to affect lowland areas along the river.
| Date | Stage (ft) |
|---|---|
| Mar 28, 1913 | 32 |
| Jan 24, 1959 | 29.5 |
| Jan 8, 2005 | 28.5 |
| Mar 21, 2008 | 28.25 |
| Jun 9, 2008 | 27 |
| Jul 17, 2015 | 26 |
| Aug 8, 2009 | 25.5 |
| Apr 27, 2011 | 25.3 |
| Mar 14, 2006 | 25 |
| Dec 24, 2013 | 24.75 |
| Feb 27, 2018 | 24.55 |
| Apr 6, 2014 | 24.5 |
| May 1, 1996 | 24.5 |
| Jan 7, 2004 | 24.45 |
| Apr 6, 2018 | 24.1 |
| Dec 31, 2015 | 23.8 |
| May 7, 2017 | 23.7 |
| Dec 19, 2001 | 23.5 |
| Jan 17, 2007 | 23.5 |
| Mar 16, 2015 | 23.4 |
Data provided by the National Weather Service.