« Back to Roaring River State Park Rivers
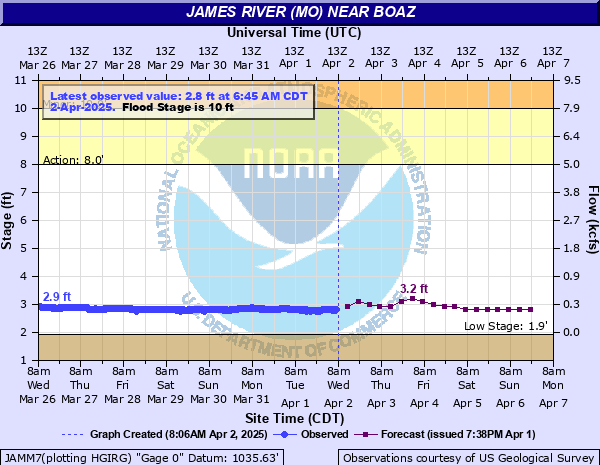
James River (MO) near Boaz
Critical Stages
8' - Action
10' - Flood
18' - Moderate
24' - Major
Latest Observation
Updated: 6:45 AM CST 12/6/25
Status: No Flooding
Stage: 2.62 ft
Flow: 0.13 kcfs
Forecast
| Time | Stage (ft) | Flow (kcfs) |
|---|---|---|
| 12 PM 12/6 | 2.6 | 0.125 |
| 6 PM 12/6 | 2.6 | 0.125 |
| 12 AM 12/7 | 2.6 | 0.125 |
| 6 AM 12/7 | 2.6 | 0.125 |
| 12 PM 12/7 | 2.6 | 0.125 |
| 6 PM 12/7 | 2.6 | 0.125 |
| 12 AM 12/8 | 2.6 | 0.125 |
| 6 AM 12/8 | 2.6 | 0.125 |
| 12 PM 12/8 | 2.6 | 0.125 |
| 6 PM 12/8 | 2.6 | 0.125 |
| 12 AM 12/9 | 2.6 | 0.125 |
| 6 AM 12/9 | 2.6 | 0.125 |
| 12 PM 12/9 | 2.6 | 0.125 |
| 6 PM 12/9 | 2.6 | 0.125 |
| 12 AM 12/10 | 2.6 | 0.125 |
| 6 AM 12/10 | 2.6 | 0.125 |
| Time | Stage (ft) | Flow (kcfs) |
|---|---|---|
| 6:45 AM 12/6 | 2.62 | 0.13 |
| 6:30 AM 12/6 | 2.62 | 0.13 |
| 6:15 AM 12/6 | 2.62 | 0.13 |
| 6:00 AM 12/6 | 2.62 | 0.13 |
| 5:45 AM 12/6 | 2.62 | 0.13 |
| 5:30 AM 12/6 | 2.62 | 0.13 |
| 5:15 AM 12/6 | 2.62 | 0.13 |
| 5:00 AM 12/6 | 2.62 | 0.13 |
| 4:45 AM 12/6 | 2.62 | 0.13 |
| 4:30 AM 12/6 | 2.62 | 0.13 |
| 4:15 AM 12/6 | 2.62 | 0.13 |
| 4:00 AM 12/6 | 2.62 | 0.13 |
| 3:45 AM 12/6 | 2.62 | 0.13 |
| 3:30 AM 12/6 | 2.63 | 0.133 |
| 3:15 AM 12/6 | 2.63 | 0.133 |
| 3:00 AM 12/6 | 2.63 | 0.133 |
| 2:45 AM 12/6 | 2.63 | 0.133 |
| 2:30 AM 12/6 | 2.63 | 0.133 |
| 2:15 AM 12/6 | 2.63 | 0.133 |
| 2:00 AM 12/6 | 2.63 | 0.133 |
| 1:45 AM 12/6 | 2.63 | 0.133 |
| 1:30 AM 12/6 | 2.63 | 0.133 |
| 1:15 AM 12/6 | 2.62 | 0.13 |
| 1:00 AM 12/6 | 2.62 | 0.13 |
| 12:45 AM 12/6 | 2.62 | 0.13 |
| 12:30 AM 12/6 | 2.62 | 0.13 |
| 12:15 AM 12/6 | 2.62 | 0.13 |
| 12:00 AM 12/6 | 2.62 | 0.13 |
| 11:45 PM 12/5 | 2.62 | 0.13 |
| 11:30 PM 12/5 | 2.62 | 0.13 |
26' -
The lower portion of the Big Bend Bridge begins to flood.
24' -
Major Flood Stage. Structures and many low lying roads near the river become damaged by debris in the water.
18' -
Moderate Flood Stage. Water approaches structures near the river. Approximate level of the one percent chance flood.
16' -
Low water crossing on the west side of the bridge at the gage site floods. Low lying areas on the west side of the river are under several feet of water. Shelvin Rock Access is flooded by several feet of water.
14' -
Approximate level when Hootentown Access and Campground downstream of the gage floods.
10' -
Low lying areas near the river flood. Flows may be dangerous for canoers.
| Date | Stage (ft) |
|---|---|
| Apr 30, 2017 | 25.1 |
| Mar 19, 2008 | 23.55 |
| Jun 20, 2015 | 22.96 |
| Dec 28, 2015 | 22.1 |
| Apr 25, 2011 | 20.82 |
| Jul 1, 1973 | 20.56 |
| May 6, 2022 | 18.85 |
| Mar 25, 2023 | 18.59 |
| Feb 25, 2018 | 18.26 |
| Jul 3, 2015 | 18.08 |
| May 21, 1979 | 17.95 |
| Sep 27, 1977 | 17.49 |
| Oct 10, 2009 | 17.09 |
| May 8, 2002 | 16.76 |
| Jul 11, 2015 | 15.82 |
| May 22, 2019 | 15.38 |
| Mar 20, 2020 | 15.23 |
| Jan 12, 2020 | 15.16 |
| Nov 25, 1973 | 14.88 |
| Jun 2, 2013 | 14.5 |
Data provided by the National Weather Service.