« Back to Roaring River State Park Rivers
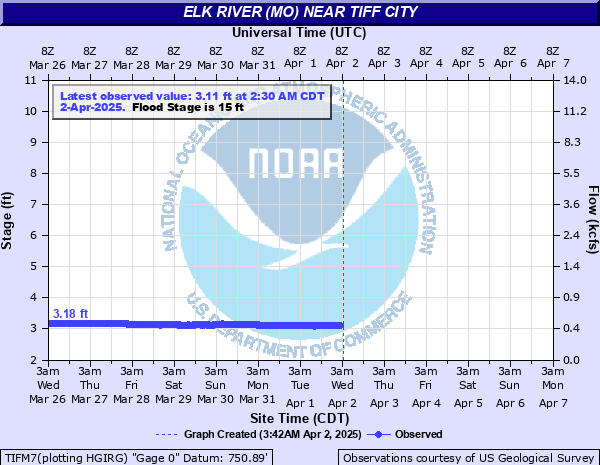
Elk River (MO) near Tiff City
Critical Stages
13' - Action
15' - Flood
20' - Moderate
25' - Major
Latest Observation
Updated: 6:30 AM CST 12/6/25
Status: No Flooding
Stage: 3.25 ft
Flow: 0.237 kcfs
Forecast
Forecast not available for this location.
| Time | Stage (ft) | Flow (kcfs) |
|---|---|---|
| 6:30 AM 12/6 | 3.25 | 0.237 |
| 6:15 AM 12/6 | 3.25 | 0.237 |
| 6:00 AM 12/6 | 3.25 | 0.237 |
| 5:45 AM 12/6 | 3.25 | 0.237 |
| 5:30 AM 12/6 | 3.25 | 0.237 |
| 5:15 AM 12/6 | 3.24 | 0.233 |
| 5:00 AM 12/6 | 3.25 | 0.237 |
| 4:45 AM 12/6 | 3.25 | 0.237 |
| 4:30 AM 12/6 | 3.24 | 0.233 |
| 4:15 AM 12/6 | 3.25 | 0.237 |
| 4:00 AM 12/6 | 3.25 | 0.237 |
| 3:45 AM 12/6 | 3.25 | 0.237 |
| 3:30 AM 12/6 | 3.25 | 0.237 |
| 3:15 AM 12/6 | 3.25 | 0.237 |
| 3:00 AM 12/6 | 3.25 | 0.237 |
| 2:45 AM 12/6 | 3.24 | 0.233 |
| 2:30 AM 12/6 | 3.25 | 0.237 |
| 2:15 AM 12/6 | 3.25 | 0.237 |
| 2:00 AM 12/6 | 3.25 | 0.237 |
| 1:45 AM 12/6 | 3.26 | 0.24 |
| 1:30 AM 12/6 | 3.25 | 0.237 |
| 1:15 AM 12/6 | 3.25 | 0.237 |
| 1:00 AM 12/6 | 3.25 | 0.237 |
| 12:45 AM 12/6 | 3.25 | 0.237 |
| 12:30 AM 12/6 | 3.25 | 0.237 |
| 12:15 AM 12/6 | 3.25 | 0.237 |
| 12:00 AM 12/6 | 3.25 | 0.237 |
| 11:45 PM 12/5 | 3.25 | 0.237 |
| 11:30 PM 12/5 | 3.25 | 0.237 |
| 11:15 PM 12/5 | 3.26 | 0.24 |
32' -
flood waters reach the Highway 43 Bridge.
28.4' -
this is the level reached on April 19 1941.
27.39' -
this is the crest level set on April 30, 2017 and December 27, 2015.
25' -
major flooding occurs at the gage site. Homes on the east side of Noel near the river may flood as well as Highways 59 and 90.
22' -
flooding occurs on H Highway and at the intersection of Highways 59 and 90. The water treatment plant at the Tyson Plant begins to flood.
20' -
moderate flood stage. Flood waters affect the north and south side of the Highway 43 Bridge and the Cowskin Public Fishing access area on the northeast side of the bridge. The Waste Water Treatment Plant begins flood prevention measures.
18' -
flooding closes Routes TT and DD.
15' -
minor flooding occurs at the gage site. The Cowskin River Floating Public Access Area on the west side of Highway 43 floods. The access road to the RV Park at Herman's Campground two miles upstream from the bridge floods.
| Date | Stage (ft) |
|---|---|
| Apr 19, 1941 | 28.4 |
| Dec 27, 2015 | 27.39 |
| Apr 30, 2017 | 27.39 |
| Apr 25, 2011 | 26.61 |
| Mar 19, 2008 | 25.39 |
| May 24, 2011 | 24.87 |
| May 21, 1957 | 24.72 |
| Jun 11, 1995 | 24.45 |
| Aug 9, 2013 | 24.11 |
| Aug 9, 2013 | 23.95 |
| May 18, 1943 | 23.6 |
| May 10, 1943 | 23.55 |
| Apr 8, 1986 | 23.52 |
| Apr 15, 1945 | 23.5 |
| Apr 11, 2008 | 23.35 |
| Nov 4, 1974 | 23.32 |
| Jun 24, 2019 | 23.29 |
| May 15, 1956 | 23.14 |
| Mar 24, 2023 | 22.61 |
| Jun 14, 1964 | 22.58 |
Data provided by the National Weather Service.