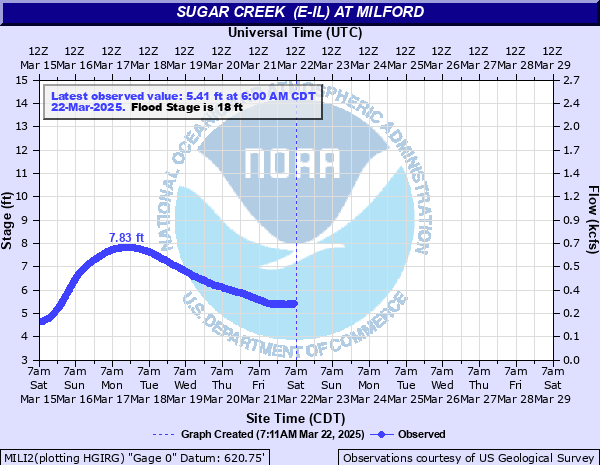
Sugar Creek (E-IL) at Milford
Critical Stages
15' - Action
18' - Flood
22' - Moderate
26' - Major
Latest Observation
Updated: 11:00 AM CST 12/16/25
Status: Low Threshold
Stage: 2.39 ft
Flow: 0.001 kcfs
Forecast
Forecast not available for this location.
| Time | Stage (ft) | Flow (kcfs) |
|---|---|---|
| 11:00 AM 12/16 | 2.39 | 0.001 |
| 10:45 AM 12/16 | 2.41 | 0.0011 |
| 10:30 AM 12/16 | 2.42 | 0.0012 |
| 10:15 AM 12/16 | 2.43 | 0.0014 |
| 10:00 AM 12/16 | 2.44 | 0.0016 |
| 9:45 AM 12/16 | 2.44 | 0.0016 |
| 9:30 AM 12/16 | 2.43 | 0.0014 |
| 9:15 AM 12/16 | 2.44 | 0.0016 |
| 9:00 AM 12/16 | 2.44 | 0.0016 |
| 8:45 AM 12/16 | 2.44 | 0.0016 |
| 8:30 AM 12/16 | 2.43 | 0.0014 |
| 8:15 AM 12/16 | 2.43 | 0.0014 |
| 8:00 AM 12/16 | 2.43 | 0.0014 |
| 7:45 AM 12/16 | 2.43 | 0.0014 |
| 7:30 AM 12/16 | 2.42 | 0.0012 |
| 7:15 AM 12/16 | 2.42 | 0.0012 |
| 7:00 AM 12/16 | 2.42 | 0.0012 |
| 6:45 AM 12/16 | 2.43 | 0.0014 |
| 6:30 AM 12/16 | 2.43 | 0.0014 |
| 6:15 AM 12/16 | 2.43 | 0.0014 |
| 6:00 AM 12/16 | 2.43 | 0.0014 |
| 5:45 AM 12/16 | 2.44 | 0.0016 |
| 5:30 AM 12/16 | 2.44 | 0.0016 |
| 5:15 AM 12/16 | 2.44 | 0.0016 |
| 5:00 AM 12/16 | 2.45 | 0.0017 |
| 4:45 AM 12/16 | 2.46 | 0.0019 |
| 4:30 AM 12/16 | 2.45 | 0.0017 |
| 4:15 AM 12/16 | 2.46 | 0.0019 |
| 4:00 AM 12/16 | 2.47 | 0.0022 |
| 3:45 AM 12/16 | 2.47 | 0.0022 |
28' -
Structures threatened in Woodland. IL-1 (Chicago Street) threatened in Milford.
27.5' -
Numerous residences threatened in southwest Milford. County road 1400N threatened in Woodland.
27' -
County road 980N threatened in Milford.
26' -
Widespread inundation of structures and roadways begins in southwest Watseka. County road 1200N threatened south of Woodland.
25' -
Structures threatened in southwest Watseca. County road 980N threatened west of Milford. Widespread flooding of agricultural areas.
24' -
US-24 (Lafayette Street) threatened in west Watseka.
19' -
Structures threatened in southwest Milford.
18' -
County road 1090N threatened east of the river north of Milford. Recreation fields inundated near the river in southwest Milford. Roadways are threatened at Legion Park in Watseka.
17' -
Low-lying sections of Legion Park are inundated in Watseka.
15' -
Low-lying areas near the river begin to flood.
| Date | Stage (ft) |
|---|---|
| Jan 8, 2008 | 28.66 |
| Feb 21, 2018 | 28.49 |
| Apr 12, 1994 | 28.16 |
| Dec 29, 2015 | 26.32 |
| Jun 18, 1996 | 25.85 |
| Jun 12, 2004 | 24.28 |
| Feb 10, 1959 | 23.74 |
| Mar 11, 2009 | 23.63 |
| Mar 5, 1979 | 23.33 |
| Jul 13, 1957 | 23.22 |
| Jul 12, 2015 | 23.14 |
| Feb 24, 1985 | 22.97 |
| Jun 23, 2010 | 22.92 |
| Jun 3, 1980 | 22.66 |
| Jan 14, 2005 | 22.66 |
| Apr 19, 2013 | 22.46 |
| Jan 5, 1993 | 22.07 |
| Nov 19, 2017 | 22.04 |
| May 8, 1998 | 21.3 |
| May 26, 1984 | 21.15 |
Data provided by the National Weather Service.