James River (MO) near Springfield
Critical Stages
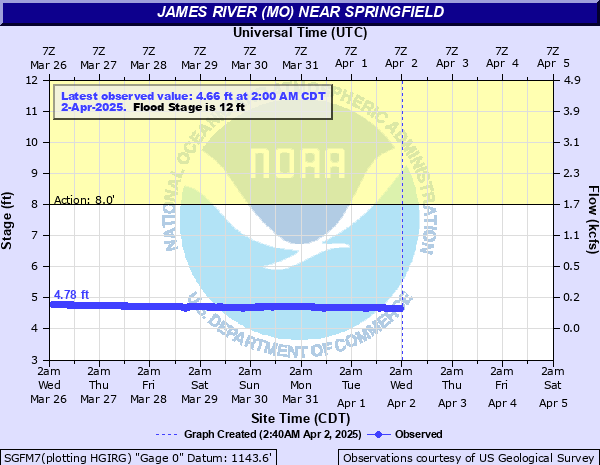
8' - Action
12' - Flood
15' - Moderate
20' - Major
Latest Observation
Updated: 4:00 PM CST 12/15/25
Status: No Flooding
Stage: 4.52 ft
Flow: 0.0447 kcfs
Forecast
Forecast not available for this location.
| Time | Stage (ft) | Flow (kcfs) |
|---|---|---|
| 5:00 PM 12/15 | 4.48 | 0.0411 |
| 4:45 PM 12/15 | 4.49 | 0.042 |
| 4:30 PM 12/15 | 4.5 | 0.0429 |
| 4:15 PM 12/15 | 4.51 | 0.0438 |
| 4:00 PM 12/15 | 4.52 | 0.0447 |
| 3:45 PM 12/15 | 4.53 | 0.0457 |
| 3:30 PM 12/15 | 4.54 | 0.0467 |
| 3:15 PM 12/15 | 4.54 | 0.0467 |
| 3:00 PM 12/15 | 4.54 | 0.0467 |
| 2:45 PM 12/15 | 4.55 | 0.0477 |
| 2:30 PM 12/15 | 4.55 | 0.0477 |
| 2:15 PM 12/15 | 4.56 | 0.0487 |
| 2:00 PM 12/15 | 4.56 | 0.0487 |
| 1:45 PM 12/15 | 4.56 | 0.0487 |
| 1:30 PM 12/15 | 4.57 | 0.0497 |
| 1:15 PM 12/15 | 4.57 | 0.0497 |
| 1:00 PM 12/15 | 4.58 | 0.0508 |
| 12:45 PM 12/15 | 4.59 | 0.0518 |
| 12:30 PM 12/15 | 4.59 | 0.0518 |
| 12:15 PM 12/15 | 4.6 | 0.0529 |
| 12:00 PM 12/15 | 4.61 | 0.054 |
| 11:45 AM 12/15 | 4.61 | 0.054 |
| 11:30 AM 12/15 | 4.62 | 0.0552 |
| 11:15 AM 12/15 | 4.62 | 0.0552 |
| 11:00 AM 12/15 | 4.62 | 0.0552 |
| 10:45 AM 12/15 | 4.62 | 0.0552 |
| 10:30 AM 12/15 | 4.62 | 0.0552 |
| 10:15 AM 12/15 | 4.62 | 0.0552 |
| 10:00 AM 12/15 | 4.62 | 0.0552 |
| 9:45 AM 12/15 | 4.62 | 0.0552 |
22' -
River levels reach the bottom of the bridge deck of the bridge on Campbell Avenue, downstream from the gage site.
21.55' -
Approximate level of the one percent chance flood.
20.92' -
This is the level reached on April 30, 2017.
20' -
Flood waters impact the north-bound Highway 65 off-ramp to James River Freeway (Highway 60).
15' -
Flood waters cover Kisner Road and South Farm Road 193 near the gage site.
12' -
Flood waters cover portions of South Farm Road 193 three tenths of a mile upstream from the gage on the west side of the river.
8' -
River levels approach portions of South Farm Road 193 upstream from the gage site.
| Date | Stage (ft) |
|---|---|
| Jun 19, 2015 | 22.2 |
| Jul 1, 1909 | 22 |
| Apr 30, 2017 | 20.9 |
| Sep 25, 1993 | 19.45 |
| Jul 2, 2015 | 19.45 |
| Mar 18, 2008 | 19.32 |
| Dec 27, 2015 | 18.92 |
| Apr 26, 2011 | 18.85 |
| Mar 24, 2023 | 18.71 |
| Jun 14, 2008 | 18.53 |
| May 5, 2022 | 18.29 |
| Dec 17, 1957 | 18.2 |
| Sep 27, 1977 | 18.14 |
| Feb 24, 2018 | 17.62 |
| Sep 14, 2008 | 17.52 |
| May 20, 1979 | 17.45 |
| Feb 23, 1985 | 17.41 |
| Oct 9, 2009 | 17.39 |
| Jun 12, 2007 | 17.36 |
| May 8, 2002 | 17.34 |
Data provided by the National Weather Service.