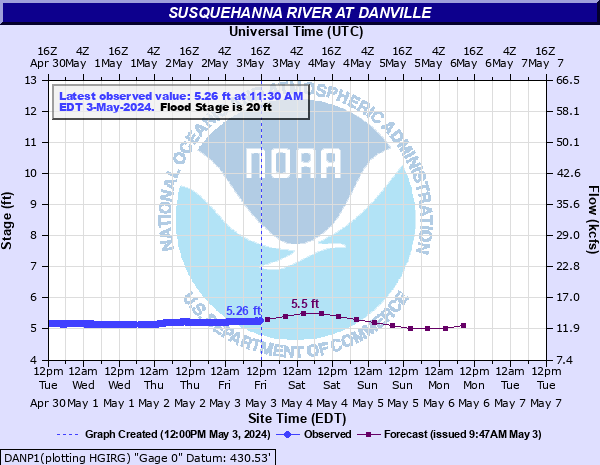
Susquehanna River at Danville
Critical Stages
15' - Action
20' - Flood
23' - Moderate
30' - Major
Latest Observation
Updated: 12:30 AM EST 12/16/25
Status: No Flooding
Stage: 4.32 ft
Flow: 8.82 kcfs
Forecast
| Time | Stage (ft) | Flow (kcfs) |
|---|---|---|
| 7 AM 12/16 | 2.9 | 3.46 |
| 1 PM 12/16 | 2.9 | 3.46 |
| 7 PM 12/16 | 2.8 | 3.16 |
| 1 AM 12/17 | 2.8 | 3.16 |
| 7 AM 12/17 | 2.8 | 3.16 |
| 1 PM 12/17 | 2.8 | 3.16 |
| 7 PM 12/17 | 2.8 | 3.16 |
| 1 AM 12/18 | 2.8 | 3.16 |
| 7 AM 12/18 | 2.8 | 3.16 |
| Time | Stage (ft) | Flow (kcfs) |
|---|---|---|
| 12:30 AM 12/16 | 4.32 | 8.82 |
| 12:15 AM 12/16 | 4.26 | 8.56 |
| 12:00 AM 12/16 | 4.37 | 9.05 |
| 11:45 PM 12/15 | 4.9 | 11.4 |
| 11:30 PM 12/15 | 5.2 | 12.9 |
| 11:15 PM 12/15 | 5.21 | 12.9 |
| 11:00 PM 12/15 | 5.19 | 12.8 |
| 10:45 PM 12/15 | 5.15 | 12.6 |
| 10:30 PM 12/15 | 5.08 | 12.3 |
| 10:15 PM 12/15 | 4.99 | 11.9 |
| 10:00 PM 12/15 | 4.92 | 11.5 |
| 9:45 PM 12/15 | 4.85 | 11.2 |
| 9:30 PM 12/15 | 4.8 | 11 |
| 9:15 PM 12/15 | 4.74 | 10.7 |
| 9:00 PM 12/15 | 4.71 | 10.6 |
| 8:45 PM 12/15 | 4.69 | 10.5 |
| 8:30 PM 12/15 | 4.63 | 10.2 |
| 8:15 PM 12/15 | 4.53 | 9.75 |
| 8:00 PM 12/15 | 4.45 | 9.4 |
| 7:45 PM 12/15 | 4.35 | 8.96 |
| 7:30 PM 12/15 | 4.32 | 8.82 |
| 7:15 PM 12/15 | 4.46 | 9.44 |
| 7:00 PM 12/15 | 4.47 | 9.48 |
| 6:45 PM 12/15 | 4.45 | 9.4 |
| 6:30 PM 12/15 | 4.43 | 9.31 |
| 6:15 PM 12/15 | 4.4 | 9.18 |
| 6:00 PM 12/15 | 4.34 | 8.91 |
| 5:45 PM 12/15 | 4.28 | 8.65 |
| 5:30 PM 12/15 | 4.27 | 8.6 |
| 5:15 PM 12/15 | 4.22 | 8.38 |
41.5' -
Flood waters begin to reach the Rupert Drive Bridge in Catawissa.
38' -
FEMA 0.2 0X0P+0nnual Chance Flood Level (500-year flood).
34' -
Levee system on the right bank begins to overflow. Widespread flooding continues in unprotected areas. Low lying areas within the levee system begin to be affected.
32.3' -
Flood of record from Hurricane Agnes in 1972.
32' -
Areas outside of the levee system experiences widespread flooding. The levee system protects most of Danville to a height of 34 feet.
31.5' -
FEMA 1 0X0P+0nnual Chance Flood Level (100-year flood).
30.5' -
Flood waters begin to reach the Danville Riverside Bridge.
30' -
Much of Riverside on the left bank is affected by high water. Water levels approach the pump station on the right bank just downstream of the highway bridge.
29' -
FEMA 2 0X0P+0nnual Chance Flood Level (50-year flood).
24.5' -
FEMA 10 0X0P+0nnual Chance Flood Level (10-year flood). Flood waters begin to affects residences in Riverside on the left bank of the river.
24' -
Inundation in Riverside on the left bank of the river begins to affect residences.
23' -
Flooding occurs at the state hospital grounds on the east side of town. Backwater produces flooding on Sechler Run in the center of town.
21' -
Basements flood in homes along Mahoning Creek on the right bank of the river.
20' -
Inundation begins in Riverside on the left bank.
| Date | Stage (ft) |
|---|---|
| Jun 24, 1972 | 32.32 |
| Sep 9, 2011 | 31.55 |
| Mar 9, 1904 | 30.71 |
| Jun 28, 2006 | 28.19 |
| Mar 19, 1936 | 28.01 |
| Mar 18, 1865 | 28 |
| Sep 28, 1975 | 27.52 |
| Sep 19, 2004 | 26.22 |
| Jan 25, 1904 | 26.2 |
| Mar 3, 1902 | 26.2 |
| May 9, 1946 | 25.98 |
| Jan 21, 1996 | 25.969999313354 |
| Apr 2, 1940 | 25.25 |
| Mar 11, 1964 | 25.13 |
| Feb 10, 1904 | 24.6 |
| Apr 4, 2005 | 24.28 |
| Apr 7, 1984 | 24.14 |
| Jan 1, 1943 | 24 |
| Apr 3, 1993 | 23.97 |
| Mar 7, 1979 | 23.93 |
Data provided by the National Weather Service.