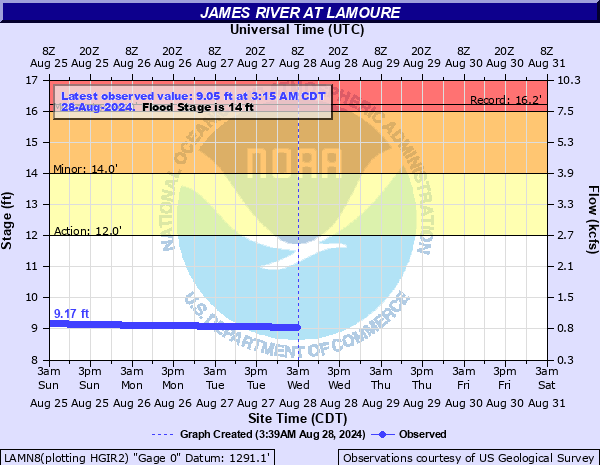
James River at LaMoure
Critical Stages
12' - Action
14' - Flood
16' - Moderate
18' - Major
Latest Observation
Updated: 8:15 PM CST 12/15/25
Status: No Flooding
Stage: 7.95 ft
Flow: 0.262 kcfs
Forecast
Forecast not available for this location.
| Time | Stage (ft) | Flow (kcfs) |
|---|---|---|
| 8:15 PM 12/15 | 7.95 | 0.262 |
| 8:00 PM 12/15 | 7.95 | 0.262 |
| 7:45 PM 12/15 | 7.95 | 0.262 |
| 7:30 PM 12/15 | 7.95 | 0.262 |
| 7:15 PM 12/15 | 7.95 | 0.262 |
| 7:00 PM 12/15 | 7.95 | 0.262 |
| 6:45 PM 12/15 | 7.95 | 0.262 |
| 6:30 PM 12/15 | 7.95 | 0.262 |
| 6:15 PM 12/15 | 7.95 | 0.262 |
| 6:00 PM 12/15 | 7.95 | 0.262 |
| 5:45 PM 12/15 | 7.95 | 0.262 |
| 5:30 PM 12/15 | 7.96 | 0.265 |
| 5:15 PM 12/15 | 7.96 | 0.265 |
| 5:00 PM 12/15 | 7.96 | 0.265 |
| 4:45 PM 12/15 | 7.96 | 0.265 |
| 4:30 PM 12/15 | 7.96 | 0.265 |
| 4:15 PM 12/15 | 7.96 | 0.265 |
| 4:00 PM 12/15 | 7.96 | 0.265 |
| 3:45 PM 12/15 | 7.96 | 0.265 |
| 3:30 PM 12/15 | 7.96 | 0.265 |
| 3:15 PM 12/15 | 7.96 | 0.265 |
| 3:00 PM 12/15 | 7.96 | 0.265 |
| 2:45 PM 12/15 | 7.96 | 0.265 |
| 2:30 PM 12/15 | 7.96 | 0.265 |
| 2:15 PM 12/15 | 7.96 | 0.265 |
| 2:00 PM 12/15 | 7.96 | 0.265 |
| 1:45 PM 12/15 | 7.96 | 0.265 |
| 1:30 PM 12/15 | 7.96 | 0.265 |
| 1:15 PM 12/15 | 7.96 | 0.265 |
| 1:00 PM 12/15 | 7.96 | 0.265 |
18' -
Dikes are topped when river level reaches 18-20 feet.
17.5' -
The two western-most city lagoons are threatened with inundation.
16.6' -
Water begins to appear on Highway 13 about 0.5 to 1.0 mile west of LaMoure.
16' -
South side of County Highway 13 floods. The town of Lamoure does not flood at this height.
15' -
Water starts to threaten the northwest side of town near the John Deere dealer.
14' -
Urban flood stage.
13.7' -
Rising water begins to affect the city of LaMoure's sewer system. Water restrictions have been used in the past to counteract these effects.
9.3' -
Small dam downstream from gage floods.
8' -
Rural flood stage.
| Date | Stage (ft) |
|---|---|
| Apr 15, 2009 | 17.56 |
| Mar 27, 2009 | 16.52 |
| May 24, 1969 | 16.2 |
| Apr 14, 1969 | 16.17 |
| Apr 1, 1997 | 16.09 |
| Apr 4, 2019 | 15.97 |
| Mar 21, 2010 | 15.8 |
| May 16, 1950 | 15.34 |
| Oct 26, 2019 | 15.11 |
| Apr 11, 1952 | 14.85 |
| Mar 21, 1966 | 14.85 |
| Apr 13, 1996 | 14.67 |
| Jul 21, 1993 | 14.64 |
| Apr 6, 2011 | 14.48 |
| Mar 20, 1996 | 14.43 |
| Jul 1, 2011 | 14.33 |
| Mar 24, 1994 | 14.17 |
| Apr 18, 1979 | 14.09 |
| Mar 26, 1978 | 13.74 |
| Mar 27, 2001 | 13.66 |
Data provided by the National Weather Service.