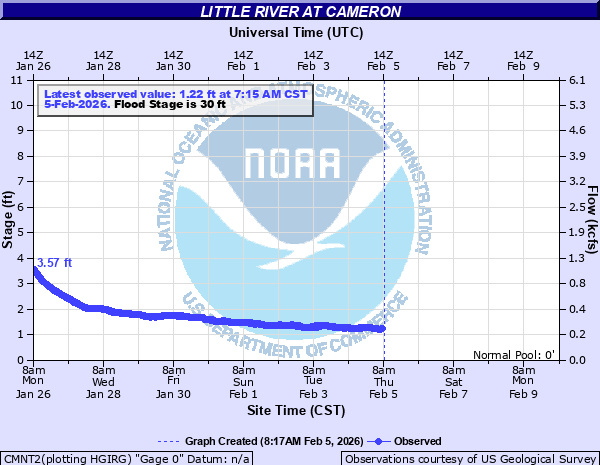
Little River at Cameron
Critical Stages
27' - Action
30' - Flood
34' - Moderate
39' - Major
Latest Observation
Updated: 10:15 PM CST 12/14/25
Status: No Flooding
Stage: 0.91 ft
Flow: 0.133 kcfs
Forecast
Forecast not available for this location.
| Time | Stage (ft) | Flow (kcfs) |
|---|---|---|
| 10:15 PM 12/14 | 0.91 | 0.133 |
| 10:00 PM 12/14 | 0.91 | 0.133 |
| 9:45 PM 12/14 | 0.91 | 0.133 |
| 9:30 PM 12/14 | 0.91 | 0.133 |
| 9:15 PM 12/14 | 0.9 | 0.131 |
| 9:00 PM 12/14 | 0.9 | 0.131 |
| 8:45 PM 12/14 | 0.9 | 0.131 |
| 8:30 PM 12/14 | 0.9 | 0.131 |
| 8:15 PM 12/14 | 0.89 | 0.129 |
| 8:00 PM 12/14 | 0.89 | 0.129 |
| 7:45 PM 12/14 | 0.89 | 0.129 |
| 7:30 PM 12/14 | 0.89 | 0.129 |
| 7:15 PM 12/14 | 0.88 | 0.127 |
| 7:00 PM 12/14 | 0.88 | 0.127 |
| 6:45 PM 12/14 | 0.88 | 0.127 |
| 6:30 PM 12/14 | 0.87 | 0.125 |
| 6:15 PM 12/14 | 0.87 | 0.125 |
| 6:00 PM 12/14 | 0.87 | 0.125 |
| 5:45 PM 12/14 | 0.87 | 0.125 |
| 5:30 PM 12/14 | 0.86 | 0.123 |
| 5:15 PM 12/14 | 0.82 | 0.115 |
| 5:00 PM 12/14 | 0.86 | 0.123 |
| 4:45 PM 12/14 | 0.83 | 0.117 |
| 4:30 PM 12/14 | 0.81 | 0.113 |
| 4:15 PM 12/14 | 0.81 | 0.113 |
| 4:00 PM 12/14 | 0.81 | 0.113 |
| 3:45 PM 12/14 | 0.81 | 0.113 |
| 3:30 PM 12/14 | 0.8 | 0.111 |
| 3:15 PM 12/14 | 0.8 | 0.111 |
| 3:00 PM 12/14 | 0.81 | 0.113 |
53.2' -
Extreme flooding of farmlands, roads, bridges, and the city sewer plant will occur.
39' -
Major lowland flooding of farmland, roads, bridges, and the city sewer plant is expected. Road closures and evacuations will be required.
35' -
Moderate lowland flooding is expected, with some road closures due to flooding.
34' -
Moderate lowland flooding is expected with some minor flood problems expected. Some rural roads will flooded.
33' -
Minor lowland flooding is expected, but no serious flooding will occur.
30' -
Minor flooding of lowland areas will occur, but no problems are expected.
27' -
Minor bankfull flow is expected, but no flooding is expected.
| Date | Stage (ft) |
|---|---|
| Sep 10, 1921 | 53.2 |
| Jan 1, 1952 | 53 |
| Dec 1, 1913 | 49 |
| Apr 25, 1957 | 39.56 |
| Dec 21, 1991 | 38.95 |
| Oct 15, 1957 | 38.9 |
| Sep 29, 1936 | 38.75 |
| Dec 23, 1991 | 38.57 |
| May 18, 1965 | 38.42 |
| Apr 23, 1945 | 37.44 |
| May 20, 1935 | 37.4 |
| Nov 25, 1940 | 37.35 |
| May 27, 1944 | 37.24 |
| Oct 6, 1959 | 37.07 |
| Jul 27, 1979 | 36.69 |
| Jan 22, 1968 | 36.67 |
| May 25, 1975 | 36.58 |
| Sep 9, 1942 | 36.32 |
| Oct 30, 1960 | 35.97 |
| Feb 5, 1992 | 35.53 |
Data provided by the National Weather Service.