« Back to Royal Oak Township Rivers
Huron River at Hamburg
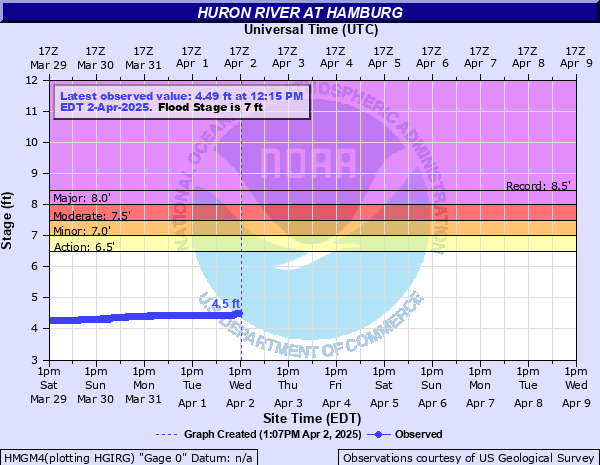
Critical Stages
6.5' - Action
7' - Flood
7.5' - Moderate
8' - Major
Latest Observation
Updated: 8:00 AM EST 12/16/25
Status: No Flooding
Stage: 3.87 ft
Flow: 0.0277 kcfs
Forecast
Forecast not available for this location.
| Time | Stage (ft) | Flow (kcfs) |
|---|---|---|
| 8:00 AM 12/16 | 3.87 | 0.0277 |
| 7:45 AM 12/16 | 3.87 | 0.0277 |
| 7:30 AM 12/16 | 3.88 | 0.0285 |
| 7:15 AM 12/16 | 3.88 | 0.0285 |
| 7:00 AM 12/16 | 3.88 | 0.0285 |
| 6:45 AM 12/16 | 3.88 | 0.0285 |
| 6:30 AM 12/16 | 3.88 | 0.0285 |
| 6:15 AM 12/16 | 3.88 | 0.0285 |
| 6:00 AM 12/16 | 3.89 | 0.0292 |
| 5:45 AM 12/16 | 3.89 | 0.0292 |
| 5:30 AM 12/16 | 3.89 | 0.0292 |
| 5:15 AM 12/16 | 3.89 | 0.0292 |
| 5:00 AM 12/16 | 3.89 | 0.0292 |
| 4:45 AM 12/16 | 3.9 | 0.03 |
| 4:30 AM 12/16 | 3.9 | 0.03 |
| 4:15 AM 12/16 | 3.9 | 0.03 |
| 4:00 AM 12/16 | 3.9 | 0.03 |
| 3:45 AM 12/16 | 3.9 | 0.03 |
| 3:30 AM 12/16 | 3.9 | 0.03 |
| 3:15 AM 12/16 | 3.91 | 0.0306 |
| 3:00 AM 12/16 | 3.91 | 0.0306 |
| 2:45 AM 12/16 | 3.91 | 0.0306 |
| 2:30 AM 12/16 | 3.91 | 0.0306 |
| 2:15 AM 12/16 | 3.91 | 0.0306 |
| 2:00 AM 12/16 | 3.91 | 0.0306 |
| 1:45 AM 12/16 | 3.91 | 0.0306 |
| 1:30 AM 12/16 | 3.91 | 0.0306 |
| 1:15 AM 12/16 | 3.91 | 0.0306 |
| 1:00 AM 12/16 | 3.91 | 0.0306 |
| 12:45 AM 12/16 | 3.91 | 0.0306 |
8' -
Many homes are surrounded and inundated with flood waters along the river and Ore Lake.
7.5' -
Flooding of houses and yards increase considerably.
7' -
***Flood stage*** Water begins to reach foundations and crawl spaces of many homes along the river and Ore Lake.
6.5' -
Water begins to flood yards of homes along the Huron River and Ore Lake. Some boat docks begin to become submerged.
6' -
The river becomes bankfull.
| Date | Stage (ft) |
|---|---|
| Jun 30, 1968 | 8.46 |
| May 15, 1956 | 8.35 |
| May 27, 2004 | 8.13 |
| Aug 16, 2021 | 8.05 |
| Aug 11, 2024 | 7.82 |
| Aug 11, 2024 | 7.82 |
| May 30, 2011 | 7.65 |
| Jul 15, 2024 | 7.64 |
| Aug 30, 2023 | 7.6 |
| Sep 18, 2008 | 7.59 |
| May 16, 2018 | 7.58 |
| Sep 27, 2021 | 7.45 |
| Jan 16, 2005 | 7.44 |
| Mar 12, 2009 | 7.39 |
| Mar 9, 1974 | 7.37 |
| Jan 15, 2020 | 7.37 |
| Jan 16, 2020 | 7.37 |
| Jan 30, 2024 | 7.35 |
| Feb 25, 2018 | 7.28 |
| Feb 13, 2001 | 7.2 |
Data provided by the National Weather Service.