Rouge River at Detroit
Critical Stages
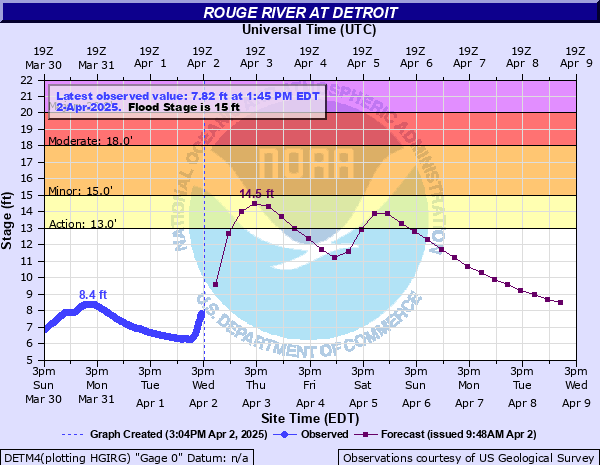
13' - Action
15' - Flood
18' - Moderate
20' - Major
Latest Observation
Updated: 12:45 AM EST 12/15/25
Status: No Flooding
Stage: 5.11 ft
Flow: 0.0465 kcfs
Forecast
Forecast not available for this location.
| Time | Stage (ft) | Flow (kcfs) |
|---|---|---|
| 12:45 AM 12/15 | 5.11 | 0.0465 |
| 12:30 AM 12/15 | 5.11 | 0.0465 |
| 12:15 AM 12/15 | 5.11 | 0.0465 |
| 12:00 AM 12/15 | 5.11 | 0.0465 |
| 11:45 PM 12/14 | 5.12 | 0.047 |
| 11:30 PM 12/14 | 5.12 | 0.047 |
| 11:15 PM 12/14 | 5.13 | 0.0475 |
| 11:00 PM 12/14 | 5.13 | 0.0475 |
| 10:45 PM 12/14 | 5.13 | 0.0475 |
| 10:30 PM 12/14 | 5.14 | 0.0479 |
| 10:15 PM 12/14 | 5.14 | 0.0479 |
| 10:00 PM 12/14 | 5.15 | 0.0484 |
| 9:45 PM 12/14 | 5.15 | 0.0484 |
| 9:30 PM 12/14 | 5.16 | 0.0489 |
| 9:15 PM 12/14 | 5.16 | 0.0489 |
| 9:00 PM 12/14 | 5.17 | 0.0495 |
| 8:45 PM 12/14 | 5.18 | 0.05 |
| 8:30 PM 12/14 | 5.19 | 0.0505 |
| 8:15 PM 12/14 | 5.2 | 0.051 |
| 8:00 PM 12/14 | 5.21 | 0.0516 |
| 7:45 PM 12/14 | 5.22 | 0.0522 |
| 7:30 PM 12/14 | 5.23 | 0.0527 |
| 7:15 PM 12/14 | 5.24 | 0.0533 |
| 7:00 PM 12/14 | 5.26 | 0.0545 |
| 6:45 PM 12/14 | 5.27 | 0.0551 |
| 6:30 PM 12/14 | 5.28 | 0.0558 |
| 6:15 PM 12/14 | 5.3 | 0.057 |
| 6:00 PM 12/14 | 5.31 | 0.0576 |
| 5:45 PM 12/14 | 5.32 | 0.0582 |
| 5:30 PM 12/14 | 5.33 | 0.0587 |
21' -
Fenkell Avenue floods to a depth of 3 feet and some businesses along Fenkell, where it crosses the upper rouge, flood. Evacuation of several residents is likely with many basements flooding in Livonia.
18' -
Flooding begins on Fenkell Avenue, Middlebelt Road, several side streets and residential areas in Redford Township and Livonia.
15' -
Flooding begins in some park areas, the River Rouge Municipal Golf Course, and a few homes. Most flood damage occurs on the Upper Rouge River with minor flooding occurring on the main branch.
14' -
The river reaches bankfull.
| Date | Stage (ft) |
|---|---|
| Jun 26, 1968 | 21.4 |
| May 26, 2011 | 20.23 |
| Oct 1, 1981 | 19.92 |
| Jun 26, 2021 | 18.94 |
| Jun 26, 2021 | 18.94 |
| Jun 22, 1989 | 17.72 |
| Jan 12, 2020 | 17.56 |
| May 13, 2018 | 17.54 |
| Aug 12, 2014 | 17.51 |
| Aug 6, 1998 | 17.36 |
| Feb 21, 2018 | 17.24 |
| Feb 18, 1998 | 17.22 |
| Jul 25, 2021 | 17.21 |
| Feb 23, 1990 | 17.19 |
| May 26, 1991 | 17.17 |
| Jan 27, 2024 | 16.97 |
| Feb 10, 2001 | 16.8 |
| Jul 3, 1997 | 16.58 |
| Jul 29, 1976 | 16.52 |
| Jun 1, 2015 | 16.44 |
Data provided by the National Weather Service.