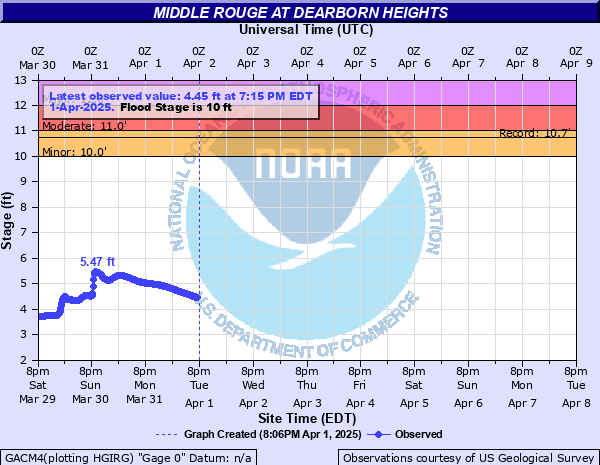
Middle Rouge at Dearborn Heights
Critical Stages
10' - Action
10' - Flood
11' - Moderate
12' - Major
Latest Observation
Updated: 12:15 AM EST 12/15/25
Status: No Flooding
Stage: 3 ft
Flow: 0.055 kcfs
Forecast
Forecast not available for this location.
| Time | Stage (ft) | Flow (kcfs) |
|---|---|---|
| 12:15 AM 12/15 | 3 | 0.055 |
| 12:00 AM 12/15 | 3 | 0.055 |
| 11:45 PM 12/14 | 3 | 0.055 |
| 11:30 PM 12/14 | 3.01 | 0.0556 |
| 11:15 PM 12/14 | 3.01 | 0.0556 |
| 11:00 PM 12/14 | 3.01 | 0.0556 |
| 10:45 PM 12/14 | 3.02 | 0.0562 |
| 10:30 PM 12/14 | 3.03 | 0.0568 |
| 10:15 PM 12/14 | 3.04 | 0.0573 |
| 10:00 PM 12/14 | 3.05 | 0.0579 |
| 9:45 PM 12/14 | 3.06 | 0.0585 |
| 9:30 PM 12/14 | 3.07 | 0.0592 |
| 9:15 PM 12/14 | 3.09 | 0.0604 |
| 9:00 PM 12/14 | 3.11 | 0.0616 |
| 8:45 PM 12/14 | 3.12 | 0.0622 |
| 8:30 PM 12/14 | 3.14 | 0.0634 |
| 8:15 PM 12/14 | 3.17 | 0.0652 |
| 8:00 PM 12/14 | 3.19 | 0.0664 |
| 7:45 PM 12/14 | 3.21 | 0.0677 |
| 7:30 PM 12/14 | 3.24 | 0.0697 |
| 7:15 PM 12/14 | 3.27 | 0.0718 |
| 7:00 PM 12/14 | 3.29 | 0.0733 |
| 6:45 PM 12/14 | 3.32 | 0.0752 |
| 6:30 PM 12/14 | 3.34 | 0.0764 |
| 6:15 PM 12/14 | 3.36 | 0.0776 |
| 6:00 PM 12/14 | 3.38 | 0.0788 |
| 5:45 PM 12/14 | 3.4 | 0.08 |
| 5:30 PM 12/14 | 3.42 | 0.0814 |
| 5:15 PM 12/14 | 3.43 | 0.0821 |
| 5:00 PM 12/14 | 3.44 | 0.0828 |
10' -
Edward Hines Drive will be under 5 feet of water in low lying spots, closing travel completely. Some sewers will begin to backup due to the river. Water will reach some roads and backyards.
7' -
Hines Park begins to flood. Part of Hines Drive will be closed to travel.
5' -
The river reaches bankfull in many places.
| Date | Stage (ft) |
|---|---|
| May 13, 2004 | 10.74 |
| Jun 26, 2021 | 10.65 |
| May 26, 2011 | 10.58 |
| May 10, 1966 | 10.5 |
| May 10, 1948 | 10.5 |
| Aug 25, 2023 | 10.19 |
| Sep 7, 1990 | 10.05 |
| Jan 12, 2020 | 9.98 |
| Jun 26, 1968 | 9.96 |
| Aug 11, 2014 | 9.9 |
| May 2, 1983 | 9.86 |
| Oct 1, 1981 | 9.71 |
| Jun 25, 2000 | 9.65 |
| Feb 10, 2001 | 9.61 |
| Feb 24, 1985 | 9.55 |
| Dec 30, 1990 | 9.51 |
| Feb 18, 1998 | 9.41 |
| Jun 22, 1989 | 9.4 |
| May 7, 1976 | 9.36 |
| Jan 5, 1993 | 9.3 |
Data provided by the National Weather Service.