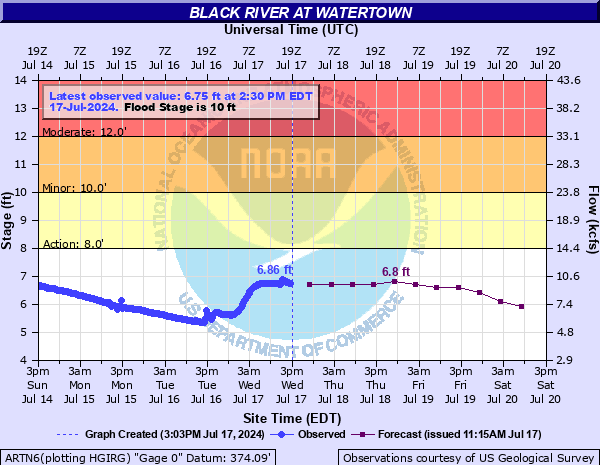
Black River at Watertown
Critical Stages
8' - Action
10' - Flood
12' - Moderate
14' - Major
Latest Observation
Updated: 7:30 PM EST 12/15/25
Status: No Flooding
Stage: 3.8 ft
Flow: 2.57 kcfs
Forecast
| Time | Stage (ft) | Flow (kcfs) |
|---|---|---|
| 1 AM 12/16 | 3.4 | 1.99 |
| 7 AM 12/16 | 3.4 | 1.99 |
| 1 PM 12/16 | 3.4 | 1.99 |
| 7 PM 12/16 | 3.3 | 1.85 |
| 1 AM 12/17 | 3.3 | 1.85 |
| 7 AM 12/17 | 3.3 | 1.85 |
| 1 PM 12/17 | 3.3 | 1.85 |
| 7 PM 12/17 | 3.3 | 1.85 |
| 1 AM 12/18 | 3.3 | 1.85 |
| 7 AM 12/18 | 3.3 | 1.85 |
| Time | Stage (ft) | Flow (kcfs) |
|---|---|---|
| 7:30 PM 12/15 | 3.8 | 2.57 |
| 7:15 PM 12/15 | 3.81 | 2.58 |
| 7:00 PM 12/15 | 3.81 | 2.58 |
| 6:45 PM 12/15 | 3.8 | 2.57 |
| 6:30 PM 12/15 | 3.8 | 2.57 |
| 6:15 PM 12/15 | 3.8 | 2.57 |
| 6:00 PM 12/15 | 3.8 | 2.57 |
| 5:45 PM 12/15 | 3.79 | 2.55 |
| 5:30 PM 12/15 | 3.79 | 2.55 |
| 5:15 PM 12/15 | 3.77 | 2.52 |
| 5:00 PM 12/15 | 3.77 | 2.52 |
| 4:45 PM 12/15 | 3.77 | 2.52 |
| 4:30 PM 12/15 | 3.76 | 2.51 |
| 4:15 PM 12/15 | 3.76 | 2.51 |
| 4:00 PM 12/15 | 3.74 | 2.48 |
| 3:45 PM 12/15 | 3.74 | 2.48 |
| 3:30 PM 12/15 | 3.73 | 2.46 |
| 3:15 PM 12/15 | 3.72 | 2.45 |
| 3:00 PM 12/15 | 3.71 | 2.43 |
| 2:45 PM 12/15 | 3.71 | 2.43 |
| 2:30 PM 12/15 | 3.69 | 2.4 |
| 2:15 PM 12/15 | 3.7 | 2.41 |
| 2:00 PM 12/15 | 3.72 | 2.45 |
| 1:45 PM 12/15 | 3.79 | 2.55 |
| 1:30 PM 12/15 | 3.94 | 2.79 |
| 1:15 PM 12/15 | 3.99 | 2.88 |
| 1:00 PM 12/15 | 3.89 | 2.71 |
| 12:45 PM 12/15 | 3.91 | 2.74 |
| 12:30 PM 12/15 | 3.95 | 2.81 |
| 12:15 PM 12/15 | 3.98 | 2.86 |
14' -
Major flood, heavy commercial, industrial, and residential damages in Watertown, Carthage, and Dexter. Flooding on Huntington Street and River Street in Watertown.
12' -
Moderate flood, widespread farmland flooding in the Flats. Numerous road closures in Castorland, Denmark, Lowville, and Carthage. Some residential properties flooded in the Flats.
10' -
Flood stage, farmland flooding begins in the Flats with some roads flooded. Minor damages to riverfront commercial properties in Dexter.
8' -
Action stage, minor agricultural flooding in the Flats area near Castorland and Croghan.
| Date | Stage (ft) |
|---|---|
| Jan 10, 1998 | 16.02 |
| Apr 12, 1993 | 14.2 |
| Apr 17, 2014 | 13.81 |
| Jan 1, 1985 | 13.15 |
| Dec 31, 1984 | 13.01 |
| Mar 16, 1977 | 12.84 |
| Apr 30, 2011 | 12.7 |
| Apr 5, 1963 | 12.43 |
| Apr 18, 1994 | 12.19 |
| May 22, 1969 | 11.86 |
| Apr 20, 1982 | 11.65 |
| Dec 16, 1984 | 11.64 |
| Dec 16, 1983 | 11.64 |
| Apr 9, 1928 | 11.6 |
| Mar 19, 1990 | 11.46 |
| May 5, 1972 | 11.32 |
| Apr 26, 1926 | 11.3 |
| Mar 24, 1948 | 11.09 |
| Feb 23, 1981 | 11.02 |
| Apr 14, 2001 | 11.01 |
Data provided by the National Weather Service.