Missouri River at Brownville
Critical Stages
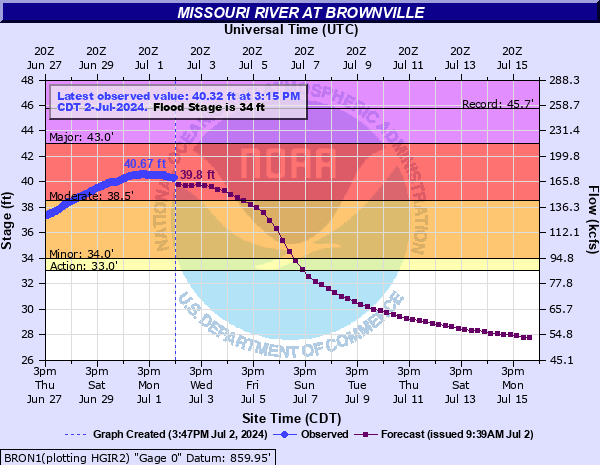
33' - Action
34' - Flood
38.5' - Moderate
43' - Major
Latest Observation
Updated: 9:15 PM CST 12/14/25
Status: No Flooding
Stage: 20.81 ft
Flow: 24.8 kcfs
Forecast
| Time | Stage (ft) | Flow (kcfs) |
|---|---|---|
| 12 AM 12/15 | 20.8 | 24.7 |
| 6 AM 12/15 | 20.7 | 24.4 |
| 12 PM 12/15 | 20.6 | 24 |
| 6 PM 12/15 | 20.5 | 23.7 |
| 12 AM 12/16 | 20.5 | 23.7 |
| 6 AM 12/16 | 20.4 | 23.3 |
| 12 PM 12/16 | 20.4 | 23.3 |
| 6 PM 12/16 | 20.4 | 23.3 |
| 12 AM 12/17 | 20.5 | 23.7 |
| 6 AM 12/17 | 20.6 | 24 |
| 12 PM 12/17 | 20.7 | 24.4 |
| 6 PM 12/17 | 20.8 | 24.7 |
| 12 AM 12/18 | 20.8 | 24.7 |
| 6 AM 12/18 | 20.9 | 25.1 |
| 12 PM 12/18 | 20.9 | 25.1 |
| 6 PM 12/18 | 20.8 | 24.7 |
| 12 AM 12/19 | 20.7 | 24.4 |
| 6 AM 12/19 | 20.6 | 24 |
| Time | Stage (ft) | Flow (kcfs) |
|---|---|---|
| 9:15 PM 12/14 | 20.81 | 24.8 |
| 9:00 PM 12/14 | 20.82 | 24.8 |
| 8:45 PM 12/14 | 20.83 | 24.9 |
| 8:30 PM 12/14 | 20.83 | 24.9 |
| 8:15 PM 12/14 | 20.84 | 24.9 |
| 8:00 PM 12/14 | 20.84 | 24.9 |
| 7:45 PM 12/14 | 20.85 | 24.9 |
| 7:30 PM 12/14 | 20.85 | 24.9 |
| 7:15 PM 12/14 | 20.86 | 25 |
| 7:00 PM 12/14 | 20.87 | 25 |
| 6:45 PM 12/14 | 20.88 | 25 |
| 6:30 PM 12/14 | 20.89 | 25.1 |
| 6:15 PM 12/14 | 20.9 | 25.1 |
| 6:00 PM 12/14 | 20.91 | 25.1 |
| 5:45 PM 12/14 | 20.92 | 25.2 |
| 5:30 PM 12/14 | 20.92 | 25.2 |
| 5:15 PM 12/14 | 20.92 | 25.2 |
| 5:00 PM 12/14 | 20.94 | 25.2 |
| 4:45 PM 12/14 | 20.94 | 25.2 |
| 4:30 PM 12/14 | 20.91 | 25.1 |
| 4:15 PM 12/14 | 20.91 | 25.1 |
| 4:00 PM 12/14 | 20.91 | 25.1 |
| 3:45 PM 12/14 | 20.91 | 25.1 |
| 3:30 PM 12/14 | 20.94 | 25.2 |
| 3:15 PM 12/14 | 20.91 | 25.1 |
| 3:00 PM 12/14 | 20.98 | 25.4 |
| 2:45 PM 12/14 | 20.97 | 25.4 |
| 2:30 PM 12/14 | 20.99 | 25.4 |
| 2:15 PM 12/14 | 20.96 | 25.3 |
| 2:00 PM 12/14 | 20.98 | 25.4 |
44' -
Water nears the top of the federal levees on both sides of the river.
43' -
A portion of the federal levee along the Missouri side will be near overtopping. If overtopped this flooding will impact a significant portion of Interstate 29 and Highway 136.
40' -
A hiking trail along the river on the Nebraska side is likely flooded.
39.5' -
The access road to the power plant begins flooding, also portions of 648A Avenue flood near Brownville.
35' -
The parking lot and boat ramp south of Highway 136 on the Nebraska side are underwater.
33' -
Agricultural lowlands along the river begin to flood.
| Date | Stage (ft) |
|---|---|
| Mar 16, 2019 | 45.73 |
| Jun 23, 2011 | 44.79 |
| Jul 24, 1993 | 44.3 |
| Jun 23, 2010 | 42.89 |
| Jun 15, 1984 | 41.2 |
| Apr 17, 1952 | 40.7 |
| Jul 1, 2024 | 40.64 |
| Jun 14, 2008 | 40.15 |
| Jun 26, 1996 | 39.7 |
| Jun 5, 2019 | 39.45 |
| Jul 1, 2018 | 39.4 |
| Oct 12, 1973 | 38.95 |
| May 7, 2007 | 38.8 |
| Jun 25, 2014 | 38.42 |
| Mar 23, 2010 | 38.17 |
| Mar 22, 1978 | 37.95 |
| Jul 5, 1998 | 37.5 |
| Jun 5, 1995 | 37.1 |
| Jun 29, 1999 | 37 |
| Jun 19, 1967 | 37 |
Data provided by the National Weather Service.