Greens Bayou at Houston
Critical Stages
52' - Action
55' - Flood
56.5' - Moderate
59.5' - Major
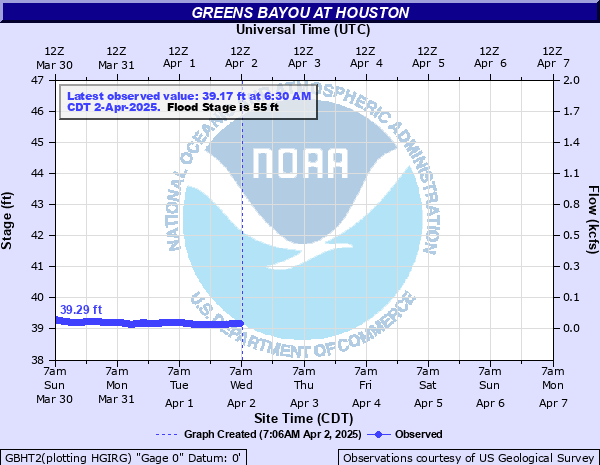
Latest Observation
Updated: 6:30 AM CST 12/8/25
Status: No Flooding
Stage: 39.26 ft
Flow: 0.0506 kcfs
Forecast
Forecast not available for this location.
| Time | Stage (ft) | Flow (kcfs) |
|---|---|---|
| 6:30 AM 12/8 | 39.26 | 0.0506 |
| 6:15 AM 12/8 | 39.26 | 0.0506 |
| 6:00 AM 12/8 | 39.27 | 0.0515 |
| 5:45 AM 12/8 | 39.27 | 0.0515 |
| 5:30 AM 12/8 | 39.27 | 0.0515 |
| 5:15 AM 12/8 | 39.27 | 0.0515 |
| 5:00 AM 12/8 | 39.27 | 0.0515 |
| 4:45 AM 12/8 | 39.28 | 0.0523 |
| 4:30 AM 12/8 | 39.28 | 0.0523 |
| 4:15 AM 12/8 | 39.28 | 0.0523 |
| 4:00 AM 12/8 | 39.28 | 0.0523 |
| 3:45 AM 12/8 | 39.28 | 0.0523 |
| 3:30 AM 12/8 | 39.29 | 0.0531 |
| 3:15 AM 12/8 | 39.29 | 0.0531 |
| 3:00 AM 12/8 | 39.29 | 0.0531 |
| 2:45 AM 12/8 | 39.29 | 0.0531 |
| 2:30 AM 12/8 | 39.3 | 0.054 |
| 2:15 AM 12/8 | 39.3 | 0.054 |
| 2:00 AM 12/8 | 39.3 | 0.054 |
| 1:45 AM 12/8 | 39.3 | 0.054 |
| 1:30 AM 12/8 | 39.3 | 0.054 |
| 1:15 AM 12/8 | 39.29 | 0.0531 |
| 1:00 AM 12/8 | 39.3 | 0.054 |
| 12:45 AM 12/8 | 39.3 | 0.054 |
| 12:30 AM 12/8 | 39.29 | 0.0531 |
| 12:15 AM 12/8 | 39.29 | 0.0531 |
| 12:00 AM 12/8 | 39.29 | 0.0531 |
| 11:45 PM 12/7 | 39.29 | 0.0531 |
| 11:30 PM 12/7 | 39.29 | 0.0531 |
| 11:15 PM 12/7 | 39.29 | 0.0531 |
61' -
Major lowland flooding continues as homes on Sequoia Bend Drive begin flooding with widespread flooding of homes on McDermott Drive.
60' -
Major lowland flooding continues as homes on McDermott Drive begin flooding.
59.5' -
Major lowland flooding begins as home in Sequoia Estates subdiviision begin flooding. Homestead Road south of the channel in inundated with one to two feet of water and water is several feet deep on the southbound feeder of U.S. Highway 59.
56.5' -
Moderate lowland flooding begins as streets in the Sequoia Estates subdivision and west of JFK Boulevard become inundated. The southbound feeder road of U.S Highway 59 is under close to one foot of water.
55' -
Minor lowland flooding begins as water escapes the north side of the upstream bank at U.S. Highway 59. Water is close to inundating the southbound feeder road south of the channel.
| Date | Stage (ft) |
|---|---|
| Aug 28, 2017 | 62.88 |
| Jun 9, 2001 | 62.39 |
| Jun 27, 1989 | 60.62 |
| Oct 25, 1984 | 60.58 |
| May 18, 1989 | 60.47 |
| Sep 12, 1961 | 60.33 |
| Mar 21, 1972 | 60.03 |
| Oct 1, 1949 | 60 |
| Oct 29, 2002 | 59.99 |
| Jun 6, 2001 | 59.75 |
| May 31, 1964 | 59.56 |
| Apr 18, 2016 | 59.53 |
| Sep 19, 2019 | 59.48 |
| Sep 20, 1979 | 59.36 |
| Jul 30, 1954 | 59.33 |
| Jun 13, 1973 | 59.28 |
| Aug 19, 1983 | 59.26 |
| Nov 17, 2003 | 59.17 |
| Feb 22, 1969 | 59.14 |
| Apr 14, 1966 | 59.01 |
Data provided by the National Weather Service.