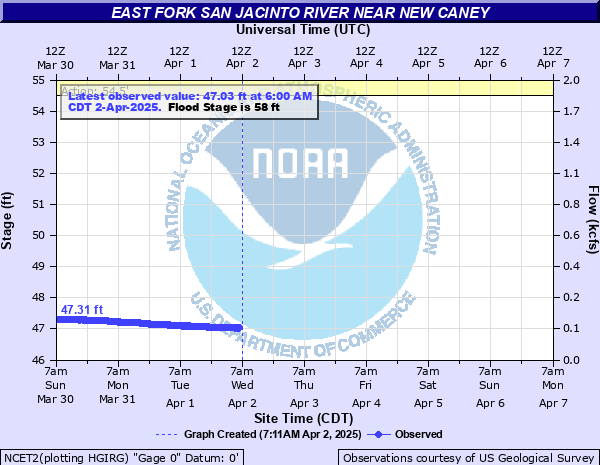
East Fork San Jacinto River near New Caney
Critical Stages
54.5' - Action
58' - Flood
62' - Moderate
69' - Major
Latest Observation
Updated: 7:00 AM CST 12/8/25
Status: No Flooding
Stage: 46.71 ft
Flow: 0.0527 kcfs
Forecast
Forecast not available for this location.
| Time | Stage (ft) | Flow (kcfs) |
|---|---|---|
| 7:00 AM 12/8 | 46.71 | 0.0527 |
| 6:45 AM 12/8 | 46.72 | 0.0533 |
| 6:30 AM 12/8 | 46.72 | 0.0533 |
| 6:15 AM 12/8 | 46.72 | 0.0533 |
| 6:00 AM 12/8 | 46.72 | 0.0533 |
| 5:45 AM 12/8 | 46.73 | 0.054 |
| 5:30 AM 12/8 | 46.73 | 0.054 |
| 5:15 AM 12/8 | 46.73 | 0.054 |
| 5:00 AM 12/8 | 46.73 | 0.054 |
| 4:45 AM 12/8 | 46.73 | 0.054 |
| 4:30 AM 12/8 | 46.74 | 0.0547 |
| 4:15 AM 12/8 | 46.74 | 0.0547 |
| 4:00 AM 12/8 | 46.74 | 0.0547 |
| 3:45 AM 12/8 | 46.74 | 0.0547 |
| 3:30 AM 12/8 | 46.74 | 0.0547 |
| 3:15 AM 12/8 | 46.74 | 0.0547 |
| 3:00 AM 12/8 | 46.74 | 0.0547 |
| 2:45 AM 12/8 | 46.75 | 0.0554 |
| 2:30 AM 12/8 | 46.75 | 0.0554 |
| 2:15 AM 12/8 | 46.75 | 0.0554 |
| 2:00 AM 12/8 | 46.75 | 0.0554 |
| 1:45 AM 12/8 | 46.75 | 0.0554 |
| 1:30 AM 12/8 | 46.76 | 0.0561 |
| 1:15 AM 12/8 | 46.76 | 0.0561 |
| 1:00 AM 12/8 | 46.76 | 0.0561 |
| 12:45 AM 12/8 | 46.76 | 0.0561 |
| 12:30 AM 12/8 | 46.76 | 0.0561 |
| 12:15 AM 12/8 | 46.77 | 0.0568 |
| 12:00 AM 12/8 | 46.77 | 0.0568 |
| 11:45 PM 12/7 | 46.77 | 0.0568 |
76.2' -
Flood of record.
69' -
Major lowland flooding begins as several homes become inundated.
68.5' -
Moderate lowland flooding continues with water over the lowest slab elevations of buildings on the downstream side near the gauge, as well as several hunting camps along the left bank approximately 2 miles downstream of the gage begin to take on water. Widespread flooding continues in the vicinity of the gage and in the right floodplain with many roads including FM 1485 inundated and closed.
62' -
Moderate lowland flooding begins with secondary roads near the river inundated, including FM 1485 west of the river.
58' -
Minor lowland flooding begins in the vicinity of the gage with minor roads such as Chinquapin and Riverside Roads beginning to flood.
54.5' -
Bankfull
| Date | Stage (ft) |
|---|---|
| Aug 29, 2017 | 81.15 |
| May 3, 2024 | 77.7 |
| Oct 19, 1994 | 76 |
| Sep 19, 2019 | 73.01 |
| Jun 1, 1973 | 72.6 |
| Nov 14, 1998 | 71.7 |
| May 29, 2016 | 69.63 |
| Jan 8, 1998 | 69.03 |
| May 19, 2024 | 67.78 |
| May 19, 1989 | 67.67 |
| Jul 26, 2024 | 67.38 |
| Nov 7, 2002 | 66.65 |
| Jun 28, 2001 | 66.45 |
| Jun 11, 2001 | 66.44 |
| Mar 31, 2018 | 66.2 |
| Dec 30, 2018 | 65.17 |
| Oct 21, 1998 | 64.84 |
| Oct 19, 2006 | 64.83 |
| Jan 29, 1995 | 64.68 |
| Jun 11, 1986 | 64.66 |
Data provided by the National Weather Service.