Spring Creek near Spring
Critical Stages
88' - Action
91.5' - Flood
95' - Moderate
100' - Major
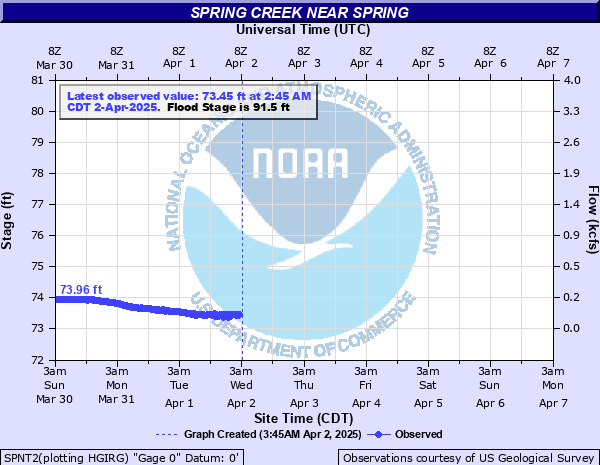
Latest Observation
Updated: 6:45 AM CST 12/8/25
Status: No Flooding
Stage: 73.6 ft
Flow: 0.141 kcfs
Forecast
Forecast not available for this location.
| Time | Stage (ft) | Flow (kcfs) |
|---|---|---|
| 6:45 AM 12/8 | 73.6 | 0.141 |
| 6:30 AM 12/8 | 73.61 | 0.143 |
| 6:15 AM 12/8 | 73.61 | 0.143 |
| 6:00 AM 12/8 | 73.62 | 0.144 |
| 5:45 AM 12/8 | 73.62 | 0.144 |
| 5:30 AM 12/8 | 73.62 | 0.144 |
| 5:15 AM 12/8 | 73.63 | 0.146 |
| 5:00 AM 12/8 | 73.64 | 0.148 |
| 4:45 AM 12/8 | 73.64 | 0.148 |
| 4:30 AM 12/8 | 73.64 | 0.148 |
| 4:15 AM 12/8 | 73.65 | 0.15 |
| 4:00 AM 12/8 | 73.66 | 0.152 |
| 3:45 AM 12/8 | 73.66 | 0.152 |
| 3:30 AM 12/8 | 73.67 | 0.153 |
| 3:15 AM 12/8 | 73.67 | 0.153 |
| 3:00 AM 12/8 | 73.67 | 0.153 |
| 2:45 AM 12/8 | 73.67 | 0.153 |
| 2:30 AM 12/8 | 73.68 | 0.155 |
| 2:15 AM 12/8 | 73.68 | 0.155 |
| 2:00 AM 12/8 | 73.68 | 0.155 |
| 1:45 AM 12/8 | 73.69 | 0.157 |
| 1:30 AM 12/8 | 73.69 | 0.157 |
| 1:15 AM 12/8 | 73.7 | 0.159 |
| 1:00 AM 12/8 | 73.7 | 0.159 |
| 12:45 AM 12/8 | 73.7 | 0.159 |
| 12:30 AM 12/8 | 73.7 | 0.159 |
| 12:15 AM 12/8 | 73.7 | 0.159 |
| 12:00 AM 12/8 | 73.7 | 0.159 |
| 11:45 PM 12/7 | 73.71 | 0.161 |
| 11:30 PM 12/7 | 73.71 | 0.161 |
112' -
Top of Northgate Levee at I-45
109' -
Major lowland flooding continue with Riley Fuzzel Bridge and the northbound feeder bridge inundated.
104' -
Major lowland flooding continues.
102' -
Major lowland flooding continues with N. Hilltop Road and the northeast portion of Riley Fuzzel Road inundated.
100' -
Major lowland flooding begins as homes on Spring Creek and N. Plum Creek are inundated.
96.5' -
Moderate lowland flooding continues with the lowest slabs on Spring Creek and N. Plum Creek Roads threatened.
95' -
Moderate lowland flooding begins with some roads near the gage inundated, including Spring Creek, N. Plum Creek, and Geneva Roads. North side of I-45 turnaround is flooded and impassable.
92.5' -
Minor lowland flooding contiues with the north side of I-45 turnaround beginning to take on water.
91.5' -
Minor lowland flooding begins near the gage site as as flow escapes on the north bank. N. Plum Creek and Spring Creek Roads begin to take on water.
| Date | Stage (ft) |
|---|---|
| Oct 18, 1994 | 111.6 |
| Aug 29, 2017 | 111.52 |
| May 28, 2016 | 108.37 |
| Apr 20, 2016 | 103.68 |
| May 28, 2015 | 95.08 |
| May 30, 2014 | 88.98 |
| May 30, 1929 | 34.3 |
| Nov 25, 1940 | 33.6 |
| Aug 30, 1945 | 32.79 |
| Nov 14, 1998 | 32.29 |
| Nov 26, 1985 | 31.66 |
| Jun 4, 1950 | 30.44 |
| Jun 27, 1960 | 29.7 |
| Jun 9, 2001 | 29.65 |
| Jun 15, 1973 | 29.65 |
| May 21, 1946 | 27.97 |
| Apr 9, 1942 | 27.78 |
| May 18, 1989 | 27.43 |
| May 13, 1968 | 27.3 |
| Feb 18, 1961 | 27.17 |
Data provided by the National Weather Service.