Great Miami River at Sidney
Critical Stages
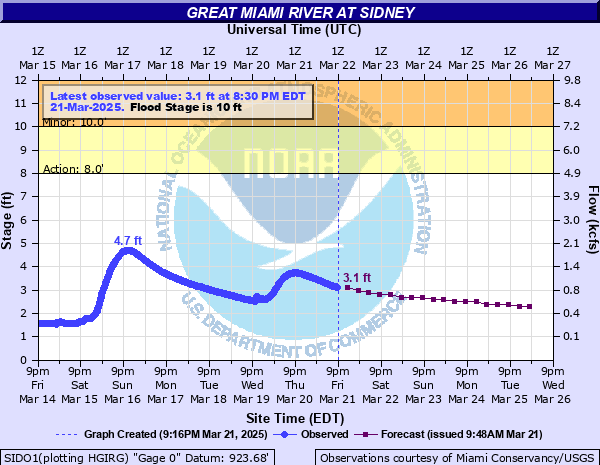
8' - Action
10' - Flood
14.6' - Moderate
18' - Major
Latest Observation
Updated: 12:30 AM EST 12/5/25
Status: No Flooding
Stage: 0.87 ft
Flow: 0.0691 kcfs
Forecast
| Time | Stage (ft) | Flow (kcfs) |
|---|---|---|
| 7 AM 12/5 | 0.9 | 0.0738 |
| 1 PM 12/5 | 0.9 | 0.0738 |
| 7 PM 12/5 | 0.9 | 0.0738 |
| 1 AM 12/6 | 0.9 | 0.0738 |
| 7 AM 12/6 | 0.9 | 0.0738 |
| 1 PM 12/6 | 0.9 | 0.0738 |
| 7 PM 12/6 | 0.9 | 0.0738 |
| 1 AM 12/7 | 0.9 | 0.0738 |
| 7 AM 12/7 | 0.9 | 0.0738 |
| 1 PM 12/7 | 0.9 | 0.0738 |
| 7 PM 12/7 | 0.9 | 0.0738 |
| 1 AM 12/8 | 0.9 | 0.0738 |
| 7 AM 12/8 | 0.9 | 0.0738 |
| 1 PM 12/8 | 0.9 | 0.0738 |
| 7 PM 12/8 | 0.9 | 0.0738 |
| 1 AM 12/9 | 0.9 | 0.0738 |
| 7 AM 12/9 | 0.9 | 0.0738 |
| Time | Stage (ft) | Flow (kcfs) |
|---|---|---|
| 12:30 AM 12/5 | 0.87 | 0.0691 |
| 12:15 AM 12/5 | 0.87 | 0.0691 |
| 12:00 AM 12/5 | 0.87 | 0.0691 |
| 11:45 PM 12/4 | 0.87 | 0.0691 |
| 11:30 PM 12/4 | 0.87 | 0.0691 |
| 11:15 PM 12/4 | 0.88 | 0.0706 |
| 11:00 PM 12/4 | 0.88 | 0.0706 |
| 10:45 PM 12/4 | 0.88 | 0.0706 |
| 10:30 PM 12/4 | 0.88 | 0.0706 |
| 10:15 PM 12/4 | 0.88 | 0.0706 |
| 10:00 PM 12/4 | 0.88 | 0.0706 |
| 9:45 PM 12/4 | 0.88 | 0.0706 |
| 9:30 PM 12/4 | 0.88 | 0.0706 |
| 9:15 PM 12/4 | 0.88 | 0.0706 |
| 9:00 PM 12/4 | 0.88 | 0.0706 |
| 8:45 PM 12/4 | 0.88 | 0.0706 |
| 8:30 PM 12/4 | 0.88 | 0.0706 |
| 8:15 PM 12/4 | 0.88 | 0.0706 |
| 8:00 PM 12/4 | 0.88 | 0.0706 |
| 7:45 PM 12/4 | 0.88 | 0.0706 |
| 7:30 PM 12/4 | 0.88 | 0.0706 |
| 7:15 PM 12/4 | 0.88 | 0.0706 |
| 7:00 PM 12/4 | 0.88 | 0.0706 |
| 6:45 PM 12/4 | 0.88 | 0.0706 |
| 6:30 PM 12/4 | 0.89 | 0.0722 |
| 6:15 PM 12/4 | 0.89 | 0.0722 |
| 6:00 PM 12/4 | 0.89 | 0.0722 |
| 5:45 PM 12/4 | 0.89 | 0.0722 |
| 5:30 PM 12/4 | 0.89 | 0.0722 |
| 5:15 PM 12/4 | 0.89 | 0.0722 |
19.6' -
This will reach the flood of record of 1913. Much of the City of Sidney would be inundated, as well as areas along the river through Shelby County. Hundreds of homes and businesses would be inundated.
18.54' -
The river will breach city flood wall with the entire south end of the city flooded. Downstream in Miami County, major flooding occurs with numerous homes and businesses impacted.
18.02' -
The river breaches the Jersey barriers on South Ohio Avenue in front of the Big Four Bridge. Flooding occurs along Crescent Drive, South Ohio and Brooklyn Avenue.
16' -
Flooding continues along Riverside Drive and Custenborder Field. In addition, flooding worsens along County Road 25A, near the cemetery, north to the Big Four Bridge. Downstream of Sidney, flooding worsens in Shelby County along the river.
14.6' -
The river breaches the west bank on County Road 25A South. County Road 25A near the cemetery will flood north to under the Big Four Bridge where the Jersey barriers are located.
14' -
Several homes and businesses are impacted on the east side of Sidney, as well as Port Jefferson.
13' -
Water approaches properties along Canal Street in Port Jefferson, with flooding worsening in Custenborder Field in Sidney. Flooding impacts yards and parking lots along Riverside Drive. Flooding extends through much of Berger Park. Flooding encroaches to near mobile homes along Brooklyn Avenue on the east side of the Great Miami.
12' -
The river breaches the bank on Riverside Drive, with flooding of Custenborder Field at the east river intake. Flooding of properties occurs along the river on Riverside Drive from the B and K Root Beer stand to the city limits.
11' -
Custenborder Field has some flooding of perimeter areas, along with flooding occurring in low spots on Miami River Road.
10' -
The river approaches the bank on the west side of Custenborder Field. At stages above 10 feet, city officials begin flood operations.
| Date | Stage (ft) |
|---|---|
| Mar 25, 1913 | 19.6 |
| Jan 21, 1959 | 15.91 |
| Dec 22, 2013 | 15.61 |
| Jul 13, 1992 | 14.58 |
| Mar 20, 1927 | 14.4 |
| Jul 9, 2003 | 14.4 |
| Dec 30, 1990 | 14.36 |
| Jan 6, 2005 | 14.16 |
| Apr 5, 2025 | 13.92 |
| Aug 8, 1995 | 13.64 |
| Jan 12, 2005 | 13.62 |
| Feb 26, 1929 | 13.6 |
| May 13, 1933 | 13.48 |
| Feb 28, 2011 | 13.18 |
| Jan 16, 1950 | 12.84 |
| Apr 21, 1920 | 12.8 |
| Apr 3, 2024 | 12.74 |
| Mar 29, 1924 | 12.62 |
| Apr 4, 2018 | 12.55 |
| Mar 5, 2011 | 12.51 |
Data provided by the National Weather Service.