« Back to Sabine Pass Coast Guard Station Rivers
Neches River at Beaumont
Critical Stages
4' - Action
4' - Flood
7' - Moderate
10' - Major
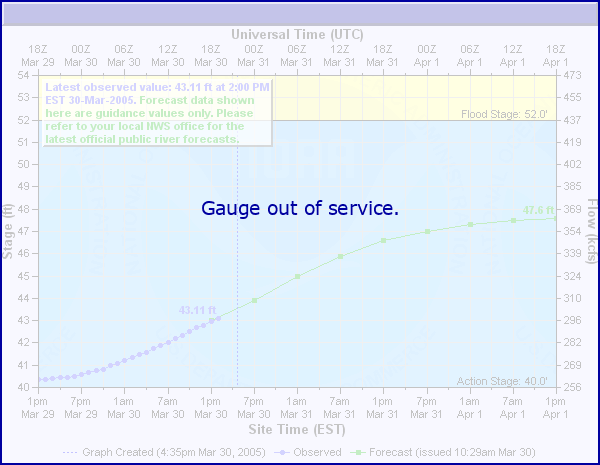
Latest Observation
Updated: 6:09 PM LMT 12/31/00
Status: Out Of Service
Stage: -999 ft
Flow: -999 kcfs
Forecast
Forecast not available for this location.
Observation history not available.
13' -
River is near flood of record which occurred october 1994. Widespread major flooding is occurring. Numerous homes in Northeast Beaumont and Rose City are flooded.
11.5' -
Major flooding is occurring. River levels are near those reached during Tropical Storm Allison in 1989. Several streets in Northeast Beaumont are flooded and impassable and water is in homes near the river. Neighborhoods on the north side of Interstate 10 in Rose City are flooded with water in approximately 4 homes.
11' -
Major flooding occurs at Colliers Ferry Park and around the Beaumont Country Club. Residential roads off of Pine Street are impassable and water up to homes. Several streets in Northeast Beaumont also become flooded.
10' -
Major flooding around the Beaumont Country Club, Colliers Ferry Park and Pine Street can be expected.
7.5' -
Moderate flooding is occurring. River levels are near those reached during Tropical Storm Allison in June 2001. Flooding of Colliers Ferry Park and secondary roads near the river can be expected.
7' -
Moderate flooding is occurring. Colliers Ferry Park is under water, and flooding of secondary roads near the river can be expected.
4' -
Minor flooding of Beaumont Country Club and Colliers Ferry Park can be expected. Also flooding in Northwest Orange County south of River Oaks to Bunns Bluff can be expected. Water may go over Four Oaks Ranch Road in Northwest Orange County.
| Date | Stage (ft) |
|---|---|
| Sep 1, 2017 | 19.59 |
| Oct 22, 1994 | 13 |
| Oct 22, 2006 | 12 |
| Jul 3, 1989 | 11.6 |
| Sep 13, 2008 | 11.2 |
| May 12, 1969 | 9.9 |
| Mar 10, 1992 | 8.5 |
| Jun 4, 2016 | 8.5 |
| Nov 10, 2002 | 8 |
| Jun 13, 2001 | 7.6 |
| Mar 13, 2016 | 7.5 |
| Jan 13, 1998 | 7.2 |
| Feb 1, 1995 | 7.1 |
| Jun 28, 1989 | 6.8 |
| Dec 18, 2001 | 6.8 |
| Jan 5, 2007 | 6.4 |
| Feb 10, 1992 | 6.4 |
| Apr 9, 1999 | 6.35 |
| Nov 5, 2015 | 6.2 |
| Jan 26, 1998 | 5.9 |
Data provided by the National Weather Service.