« Back to Sabine Pass Coast Guard Station Rivers
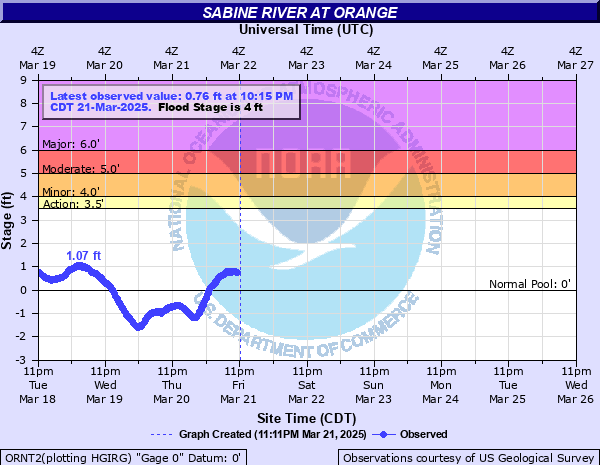
Sabine River at Orange
Critical Stages
3.5' - Action
4' - Flood
5' - Moderate
6' - Major
Latest Observation
Updated: 10:15 AM CST 12/6/25
Status: No Flooding
Stage: 0.23 ft
Flow: -999 kcfs
Forecast
Forecast not available for this location.
| Time | Stage (ft) | Flow (kcfs) |
|---|---|---|
| 10:15 AM 12/6 | 0.23 | -999 |
| 10:00 AM 12/6 | 0.26 | -999 |
| 9:45 AM 12/6 | 0.33 | -999 |
| 9:30 AM 12/6 | 0.37 | -999 |
| 9:15 AM 12/6 | 0.41 | -999 |
| 9:00 AM 12/6 | 0.45 | -999 |
| 8:45 AM 12/6 | 0.51 | -999 |
| 8:30 AM 12/6 | 0.56 | -999 |
| 8:15 AM 12/6 | 0.6 | -999 |
| 8:00 AM 12/6 | 0.66 | -999 |
| 7:45 AM 12/6 | 0.7 | -999 |
| 7:30 AM 12/6 | 0.75 | -999 |
| 7:15 AM 12/6 | 0.79 | -999 |
| 7:00 AM 12/6 | 0.81 | 0.198 |
| 6:45 AM 12/6 | 0.82 | 0.211 |
| 6:30 AM 12/6 | 0.83 | 0.224 |
| 6:15 AM 12/6 | 0.85 | 0.253 |
| 6:00 AM 12/6 | 0.88 | 0.301 |
| 5:45 AM 12/6 | 0.89 | 0.319 |
| 5:30 AM 12/6 | 0.91 | 0.357 |
| 5:15 AM 12/6 | 0.93 | 0.399 |
| 5:00 AM 12/6 | 0.93 | 0.399 |
| 4:45 AM 12/6 | 0.92 | 0.378 |
| 4:30 AM 12/6 | 0.9 | 0.338 |
| 4:15 AM 12/6 | 0.9 | 0.338 |
| 4:00 AM 12/6 | 0.91 | 0.357 |
| 3:45 AM 12/6 | 0.86 | 0.268 |
| 3:30 AM 12/6 | 0.87 | 0.284 |
| 3:15 AM 12/6 | 0.85 | 0.253 |
| 3:00 AM 12/6 | 0.85 | 0.253 |
9.86' -
Water levels are near those reached with the storm surge from Hurricane Ike in 2008. Widespread catastrophic flooding occurs across much of Orange.
6' -
Major flooding can be expected. Numerous roads and homes in Orange are subject to flooding. Backwater flooding along Adams Bayou can be expected. Water begins to approach the travel lanes on I-10.
5' -
Moderate flooding can be expected along the river with some roads in Orange likely flooded. Back water flooding can also be expected along Adams Bayou in Orange.
4' -
Flooding of mainly secondary roads near the river can be expected. Steward Road may become impassable near the weigh station in Louisiana. The Louisiana weigh station is flooded. Water surrounds the Louisiana and Texas welcome centers.
3.5' -
Minor flooding of low lying areas near the river can be expected.
| Date | Stage (ft) |
|---|---|
| Sep 13, 2008 | 9.86 |
| Sep 3, 2017 | 7.83 |
| Mar 17, 2016 | 7.62 |
| Apr 25, 1913 | 6.27 |
| Jul 8, 1989 | 5.92 |
| Aug 23, 1915 | 5.77 |
| May 24, 1953 | 5.67 |
| Apr 16, 1923 | 5.47 |
| May 2, 1914 | 5.47 |
| Jun 9, 1950 | 5.07 |
| Mar 4, 1932 | 4.87 |
| Aug 5, 1933 | 4.77 |
| Apr 14, 1922 | 4.67 |
| Dec 17, 1940 | 4.57 |
| May 25, 1989 | 4.43 |
| May 26, 1935 | 4.37 |
| Sep 23, 2020 | 4.37 |
| Dec 25, 1923 | 4.37 |
| Apr 22, 1945 | 4.17 |
| Apr 27, 1991 | 4 |
Data provided by the National Weather Service.