« Back to Samuel H Boardman State Park Rivers
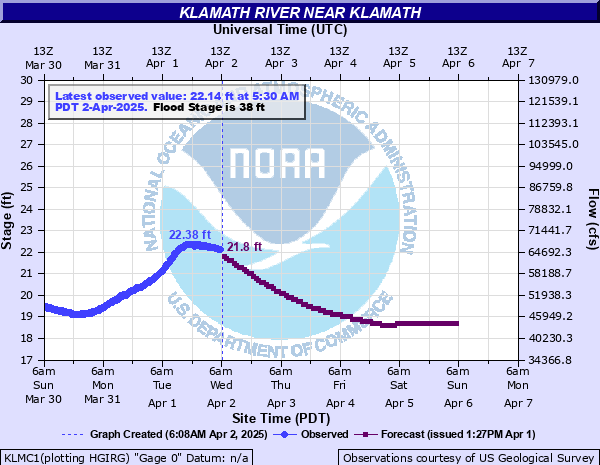
Klamath River near Klamath
Critical Stages
30' - Action
38' - Flood
42' - Moderate
46' - Major
Latest Observation
Updated: 8:30 PM PST 12/4/25
Status: No Flooding
Stage: 8.76 ft
Flow: 4.21 kcfs
Forecast
| Time | Stage (ft) | Flow (kcfs) |
|---|---|---|
| 10 PM 12/4 | 8.75 | 4.19 |
| 11 PM 12/4 | 8.75 | 4.19 |
| 12 AM 12/5 | 8.75 | 4.19 |
| 1 AM 12/5 | 8.75 | 4.19 |
| 2 AM 12/5 | 8.75 | 4.19 |
| 3 AM 12/5 | 8.75 | 4.19 |
| 4 AM 12/5 | 8.74 | 4.17 |
| 5 AM 12/5 | 8.74 | 4.17 |
| 6 AM 12/5 | 8.74 | 4.17 |
| 7 AM 12/5 | 8.74 | 4.17 |
| 8 AM 12/5 | 8.74 | 4.17 |
| 9 AM 12/5 | 8.73 | 4.15 |
| 10 AM 12/5 | 8.73 | 4.15 |
| 11 AM 12/5 | 8.73 | 4.15 |
| 12 PM 12/5 | 8.73 | 4.15 |
| 1 PM 12/5 | 8.72 | 4.13 |
| 2 PM 12/5 | 8.72 | 4.13 |
| 3 PM 12/5 | 8.72 | 4.13 |
| 4 PM 12/5 | 8.72 | 4.13 |
| 5 PM 12/5 | 8.72 | 4.13 |
| 6 PM 12/5 | 8.72 | 4.13 |
| 7 PM 12/5 | 8.71 | 4.11 |
| 8 PM 12/5 | 8.71 | 4.11 |
| 9 PM 12/5 | 8.71 | 4.11 |
| 10 PM 12/5 | 8.71 | 4.11 |
| 11 PM 12/5 | 8.71 | 4.11 |
| 12 AM 12/6 | 8.71 | 4.11 |
| 1 AM 12/6 | 8.71 | 4.11 |
| 2 AM 12/6 | 8.7 | 4.09 |
| 3 AM 12/6 | 8.7 | 4.09 |
| 4 AM 12/6 | 8.7 | 4.09 |
| 5 AM 12/6 | 8.7 | 4.09 |
| 6 AM 12/6 | 8.69 | 4.07 |
| 7 AM 12/6 | 8.69 | 4.07 |
| 8 AM 12/6 | 8.69 | 4.07 |
| 9 AM 12/6 | 8.68 | 4.05 |
| 10 AM 12/6 | 8.68 | 4.05 |
| 11 AM 12/6 | 8.68 | 4.05 |
| 12 PM 12/6 | 8.67 | 4.03 |
| 1 PM 12/6 | 8.67 | 4.03 |
| 2 PM 12/6 | 8.67 | 4.03 |
| 3 PM 12/6 | 8.67 | 4.03 |
| 4 PM 12/6 | 8.66 | 4.01 |
| 5 PM 12/6 | 8.66 | 4.01 |
| 6 PM 12/6 | 8.66 | 4.01 |
| 7 PM 12/6 | 8.66 | 4.01 |
| 8 PM 12/6 | 8.66 | 4.01 |
| 9 PM 12/6 | 8.66 | 4.01 |
| 10 PM 12/6 | 8.65 | 3.99 |
| 11 PM 12/6 | 8.65 | 3.99 |
| 12 AM 12/7 | 8.65 | 3.99 |
| 1 AM 12/7 | 8.65 | 3.99 |
| 2 AM 12/7 | 8.65 | 3.99 |
| 3 AM 12/7 | 8.65 | 3.99 |
| 4 AM 12/7 | 8.65 | 3.99 |
| 5 AM 12/7 | 8.64 | 3.97 |
| 6 AM 12/7 | 8.64 | 3.97 |
| 7 AM 12/7 | 8.64 | 3.97 |
| 8 AM 12/7 | 8.64 | 3.97 |
| 9 AM 12/7 | 8.64 | 3.97 |
| 10 AM 12/7 | 8.63 | 3.95 |
| 11 AM 12/7 | 8.63 | 3.95 |
| 12 PM 12/7 | 8.63 | 3.95 |
| 1 PM 12/7 | 8.63 | 3.95 |
| 2 PM 12/7 | 8.62 | 3.93 |
| 3 PM 12/7 | 8.62 | 3.93 |
| 4 PM 12/7 | 8.62 | 3.93 |
| 5 PM 12/7 | 8.62 | 3.93 |
| 6 PM 12/7 | 8.62 | 3.93 |
| 7 PM 12/7 | 8.62 | 3.93 |
| 8 PM 12/7 | 8.62 | 3.93 |
| 9 PM 12/7 | 8.62 | 3.93 |
| 10 PM 12/7 | 8.62 | 3.93 |
| 11 PM 12/7 | 8.62 | 3.93 |
| 12 AM 12/8 | 8.62 | 3.93 |
| 1 AM 12/8 | 8.62 | 3.93 |
| 2 AM 12/8 | 8.62 | 3.93 |
| 3 AM 12/8 | 8.62 | 3.93 |
| 4 AM 12/8 | 8.62 | 3.93 |
| 5 AM 12/8 | 8.62 | 3.93 |
| 6 AM 12/8 | 8.62 | 3.93 |
| 7 AM 12/8 | 8.62 | 3.93 |
| 8 AM 12/8 | 8.62 | 3.93 |
| 9 AM 12/8 | 8.61 | 3.91 |
| 10 AM 12/8 | 8.61 | 3.91 |
| 11 AM 12/8 | 8.61 | 3.91 |
| 12 PM 12/8 | 8.6 | 3.89 |
| 1 PM 12/8 | 8.6 | 3.89 |
| 2 PM 12/8 | 8.6 | 3.89 |
| 3 PM 12/8 | 8.59 | 3.87 |
| 4 PM 12/8 | 8.59 | 3.87 |
| 5 PM 12/8 | 8.59 | 3.87 |
| 6 PM 12/8 | 8.58 | 3.85 |
| 7 PM 12/8 | 8.58 | 3.85 |
| 8 PM 12/8 | 8.57 | 3.84 |
| 9 PM 12/8 | 8.57 | 3.84 |
| 10 PM 12/8 | 8.57 | 3.84 |
| 11 PM 12/8 | 8.56 | 3.81 |
| 12 AM 12/9 | 8.56 | 3.81 |
| 1 AM 12/9 | 8.56 | 3.81 |
| 2 AM 12/9 | 8.55 | 3.8 |
| 3 AM 12/9 | 8.55 | 3.8 |
| 4 AM 12/9 | 8.55 | 3.8 |
| Time | Stage (ft) | Flow (kcfs) |
|---|---|---|
| 8:30 PM 12/4 | 8.76 | 4.21 |
| 8:15 PM 12/4 | 8.76 | 4.21 |
| 8:00 PM 12/4 | 8.76 | 4.21 |
| 7:45 PM 12/4 | 8.76 | 4.21 |
| 7:30 PM 12/4 | 8.76 | 4.21 |
| 7:15 PM 12/4 | 8.76 | 4.21 |
| 7:00 PM 12/4 | 8.77 | 4.23 |
| 6:45 PM 12/4 | 8.76 | 4.21 |
| 6:30 PM 12/4 | 8.76 | 4.21 |
| 6:15 PM 12/4 | 8.76 | 4.21 |
| 6:00 PM 12/4 | 8.77 | 4.23 |
| 5:45 PM 12/4 | 8.77 | 4.23 |
| 5:30 PM 12/4 | 8.76 | 4.21 |
| 5:15 PM 12/4 | 8.76 | 4.21 |
| 5:00 PM 12/4 | 8.76 | 4.21 |
| 4:45 PM 12/4 | 8.76 | 4.21 |
| 4:30 PM 12/4 | 8.76 | 4.21 |
| 4:15 PM 12/4 | 8.77 | 4.23 |
| 4:00 PM 12/4 | 8.77 | 4.23 |
| 3:45 PM 12/4 | 8.77 | 4.23 |
| 3:30 PM 12/4 | 8.77 | 4.23 |
| 3:15 PM 12/4 | 8.77 | 4.23 |
| 3:00 PM 12/4 | 8.78 | 4.25 |
| 2:45 PM 12/4 | 8.77 | 4.23 |
| 2:30 PM 12/4 | 8.78 | 4.25 |
| 2:15 PM 12/4 | 8.77 | 4.23 |
| 2:00 PM 12/4 | 8.78 | 4.25 |
| 1:45 PM 12/4 | 8.78 | 4.25 |
| 1:30 PM 12/4 | 8.78 | 4.25 |
| 1:15 PM 12/4 | 8.78 | 4.25 |
66' -
Extensive and severe flooding can be expected from above Klamath Glen to the Pacific Ocean including the towns of Klamath and Klamath Glen and US Highway 101. The forecast level is over the top of the levee. Any persons living or working in areas protected by the levee should take appropriate action and move to higher ground.
65.5' -
Extensive and severe flooding can be expected from above Klamath Glen to the Pacific Ocean including the towns of Klamath and Klamath Glen and US Highway 101. The forecast level is at the top of the levee. Any persons living or working in areas protected by the levee should take appropriate action and move to higher ground. High tides and strong, onshore winds amplify effects.
65' -
Severe flooding is expected in the delta area, particularly US Highway 101 in the vicinity of Requa Road, the access road to Klamath Glen, and secondary roads. The forecast level is within 0.5 feet of top of levee. Any persons living or working in areas protected by the levee should take appropriate action and move to higher ground. High tides and strong onshore winds will amplify flooding effects.
64' -
Severe flooding is the delta area is likely, particularly US Highway 101 in the vicinity of Requa Road, the access road to Klamath Glen, and secondary roads. The forecast level is within 1.5 feet of the top of the levee. Any persons living or working in areas protected by the levee should be prepared to take appropriate action and move to higher ground. High tides and strong onshore winds will amplify flooding effects.
63' -
Severe flooding of the delta area below the levee. Most roads will be flooded and impassable, including US Highway 101 and numerous secondary roads. The forecast level is within 2.5 feet of the top of the levee protecting Klamath Glen. Any persons living or working in areas protected by the levee should be prepared to take appropriate action and move to higher ground. High tides and strong onshore winds will amplify flooding effects.
49' -
Extensive flooding along the river from Blue Creek downstream to the Pacific Ocean. Most roads in the area, including US Highway 101, Requa Rd, and the access road to Klamath Glen are likely to be flooded and impassable.
46' -
Numerous road closures are expected including US Highway 101 and secondary roads in the area. Significant flooding of many homes and businesses will occur. Loss of power is likely due to innundation of the transfer station.
42' -
Flooding of Highway 101 near Requa Rd, the access road to Klamath Glen, and adjacent low lying secondary roads near the delta is likely. Flooding will be amplified if coincident with high tides and strong onshore winds.
40' -
Flooding may occur on the access road to Klamath Glen and adjacent low lying secondary roads near the delta. Flooding will be amplified if coincident with high tides and strong, onshore winds.
38' -
Flooding of lowest lying areas is likely.
34' -
Flooding of lowest lying areas may occur.
| Date | Stage (ft) |
|---|---|
| Dec 23, 1964 | 61.29 |
| Dec 31, 2005 | 47.12 |
| Jan 1, 1997 | 43.8 |
| Feb 10, 2017 | 41.64 |
| Dec 29, 2005 | 40.52 |
| Jan 16, 1974 | 38.9 |
| Feb 18, 1986 | 36.76 |
| Dec 8, 1861 | 36.5 |
| Jan 18, 2016 | 36.33 |
| Dec 22, 1955 | 35.8 |
| Feb 1, 1890 | 35.8 |
| Dec 29, 2024 | 35.56 |
| Dec 20, 1981 | 34.2 |
| Feb 8, 2015 | 33.91 |
| Mar 3, 1972 | 33.7 |
| Jan 18, 1971 | 32.9 |
| Jan 24, 1970 | 32.8 |
| Feb 28, 2019 | 32.64 |
| Jan 22, 1972 | 32.5 |
| Mar 31, 2012 | 32.33 |
Data provided by the National Weather Service.