Pecos River above Pecos
Critical Stages
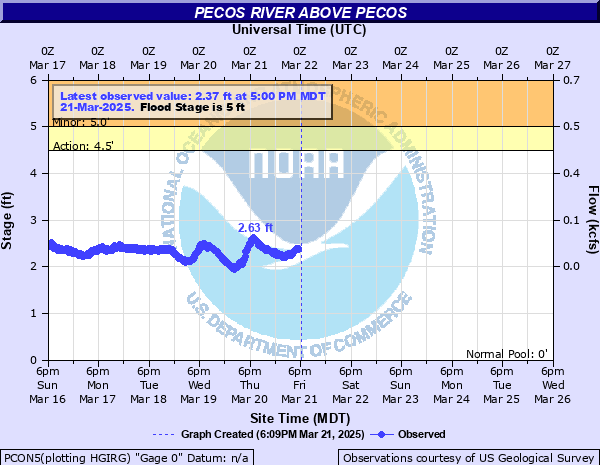
4.5' - Action
5' - Flood
6' - Moderate
7.5' - Major
Latest Observation
Updated: 3:00 AM MST 12/16/25
Status: No Flooding
Stage: 2.4 ft
Flow: 0.043 kcfs
Forecast
Forecast not available for this location.
| Time | Stage (ft) | Flow (kcfs) |
|---|---|---|
| 4:00 AM 12/16 | 2.41 | 0.0443 |
| 3:45 AM 12/16 | 2.41 | 0.0443 |
| 3:30 AM 12/16 | 2.42 | 0.0455 |
| 3:15 AM 12/16 | 2.41 | 0.0443 |
| 3:00 AM 12/16 | 2.4 | 0.043 |
| 2:45 AM 12/16 | 2.4 | 0.043 |
| 2:30 AM 12/16 | 2.41 | 0.0443 |
| 2:15 AM 12/16 | 2.42 | 0.0455 |
| 2:00 AM 12/16 | 2.43 | 0.0469 |
| 1:45 AM 12/16 | 2.44 | 0.0482 |
| 1:30 AM 12/16 | 2.43 | 0.0469 |
| 1:15 AM 12/16 | 2.44 | 0.0482 |
| 1:00 AM 12/16 | 2.43 | 0.0469 |
| 12:45 AM 12/16 | 2.43 | 0.0469 |
| 12:30 AM 12/16 | 2.43 | 0.0469 |
| 12:15 AM 12/16 | 2.44 | 0.0482 |
| 12:00 AM 12/16 | 2.44 | 0.0482 |
| 11:45 PM 12/15 | 2.44 | 0.0482 |
| 11:30 PM 12/15 | 2.45 | 0.0496 |
| 11:15 PM 12/15 | 2.45 | 0.0496 |
| 11:00 PM 12/15 | 2.45 | 0.0496 |
| 10:45 PM 12/15 | 2.46 | 0.051 |
| 10:30 PM 12/15 | 2.47 | 0.0524 |
| 10:15 PM 12/15 | 2.46 | 0.051 |
| 10:00 PM 12/15 | 2.47 | 0.0524 |
| 9:45 PM 12/15 | 2.46 | 0.051 |
| 9:30 PM 12/15 | 2.47 | 0.0524 |
| 9:15 PM 12/15 | 2.47 | 0.0524 |
| 9:00 PM 12/15 | 2.46 | 0.051 |
| 8:45 PM 12/15 | 2.47 | 0.0524 |
7.5' -
Widespread flooding is in progress or is imminent along the Upper Pecos River, mainly above the town of Pecos. Portions of state route 63 north of the fish hatchery are under water. Private bridges over the river may be washed away and homes along the river could experience significant flood damage.
6' -
Water threatens homes nearest the river along the Upper Pecos. The Pecos river has not been this high since 1929. Portions of state road 63 above the fish hatchery may become impassable due to water over the road. Private bridges on the Upper Pecos above the town of Pecos may become impassable or be washed away.
5' -
Fast flowing water may erode banks and approach homes near the river. Private bridges could drive localized flooding as debris accumulates along the upstream sides. Further rises may make bridges unsafe to cross and isolate residents.
| Date | Stage (ft) |
|---|---|
| Sep 21, 1929 | 6.2 |
| May 21, 1991 | 5.12 |
| Jun 7, 1997 | 4.79 |
| Jun 8, 1979 | 4.73 |
| Jun 18, 1995 | 4.71 |
| May 21, 1973 | 4.62 |
| May 14, 1941 | 4.57 |
| May 27, 1958 | 4.52 |
| Apr 23, 1942 | 4.28 |
| Aug 6, 1957 | 4.21 |
| May 22, 2005 | 4.19 |
| May 9, 2009 | 4.09 |
| Jun 1, 1926 | 3.99 |
| Jul 14, 1998 | 3.77 |
| May 24, 1999 | 3.75 |
| Sep 24, 1931 | 3.7 |
Data provided by the National Weather Service.