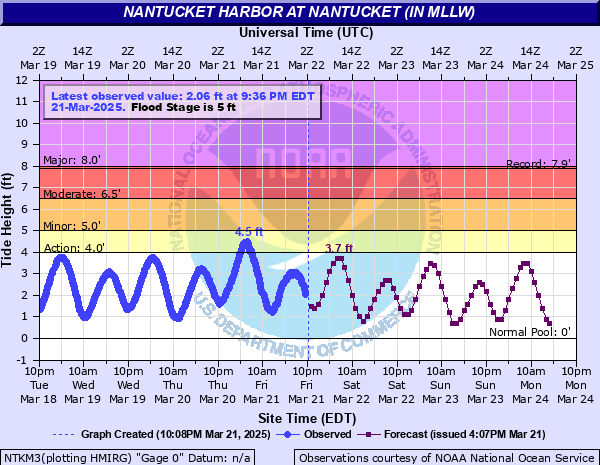
Nantucket Harbor at Nantucket (IN MLLW)
Critical Stages
4' - Action
5' - Flood
6.5' - Moderate
8' - Major
Latest Observation
Updated: 2:18 AM EST 12/16/25
Status: No Flooding
Stage: 0.78 ft
Flow: -999 kcfs
Forecast
| Time | Stage (ft) | Flow (kcfs) |
|---|---|---|
| 4 AM 12/16 | 1.1 | -999 |
| 5 AM 12/16 | 1.5 | -999 |
| 6 AM 12/16 | 2.1 | -999 |
| 7 AM 12/16 | 2.7 | -999 |
| 8 AM 12/16 | 3.2 | -999 |
| 9 AM 12/16 | 3.4 | -999 |
| 10 AM 12/16 | 3.3 | -999 |
| 11 AM 12/16 | 3 | -999 |
| 12 PM 12/16 | 2.3 | -999 |
| 1 PM 12/16 | 1.6 | -999 |
| 2 PM 12/16 | 0.9 | -999 |
| 3 PM 12/16 | 0.5 | -999 |
| 4 PM 12/16 | 0.3 | -999 |
| 5 PM 12/16 | 0.4 | -999 |
| 6 PM 12/16 | 0.8 | -999 |
| 7 PM 12/16 | 1.3 | -999 |
| 8 PM 12/16 | 1.8 | -999 |
| 9 PM 12/16 | 2.2 | -999 |
| 10 PM 12/16 | 2.3 | -999 |
| 11 PM 12/16 | 2.2 | -999 |
| 12 AM 12/17 | 1.9 | -999 |
| 1 AM 12/17 | 1.4 | -999 |
| 2 AM 12/17 | 0.9 | -999 |
| 3 AM 12/17 | 0.4 | -999 |
| 4 AM 12/17 | 0.4 | -999 |
| 5 AM 12/17 | 0.6 | -999 |
| 6 AM 12/17 | 1.2 | -999 |
| 7 AM 12/17 | 1.8 | -999 |
| 8 AM 12/17 | 2.4 | -999 |
| 9 AM 12/17 | 2.7 | -999 |
| 10 AM 12/17 | 2.9 | -999 |
| 11 AM 12/17 | 2.7 | -999 |
| 12 PM 12/17 | 2.3 | -999 |
| 1 PM 12/17 | 1.5 | -999 |
| 2 PM 12/17 | 0.7 | -999 |
| 3 PM 12/17 | -0.1 | -999 |
| 4 PM 12/17 | -0.6 | -999 |
| 5 PM 12/17 | -0.6 | -999 |
| 6 PM 12/17 | -0.3 | -999 |
| 7 PM 12/17 | 0.1 | -999 |
| 8 PM 12/17 | 0.4 | -999 |
| 9 PM 12/17 | 0.9 | -999 |
| 10 PM 12/17 | 1.3 | -999 |
| 11 PM 12/17 | 1.4 | -999 |
| 12 AM 12/18 | 1.3 | -999 |
| 1 AM 12/18 | 1 | -999 |
| 2 AM 12/18 | 0.5 | -999 |
| 3 AM 12/18 | 0 | -999 |
| 4 AM 12/18 | -0.1 | -999 |
| 5 AM 12/18 | 0.1 | -999 |
| 6 AM 12/18 | 0.7 | -999 |
| 7 AM 12/18 | 1.3 | -999 |
| 8 AM 12/18 | 2 | -999 |
| 9 AM 12/18 | 2.6 | -999 |
| 10 AM 12/18 | 2.9 | -999 |
| 11 AM 12/18 | 3.1 | -999 |
| 12 PM 12/18 | 2.9 | -999 |
| 1 PM 12/18 | 2.5 | -999 |
| 2 PM 12/18 | 1.8 | -999 |
| 3 PM 12/18 | 1 | -999 |
| Time | Stage (ft) | Flow (kcfs) |
|---|---|---|
| 2:48 AM 12/16 | 0.75 | -999 |
| 2:42 AM 12/16 | 0.75 | -999 |
| 2:36 AM 12/16 | 0.75 | -999 |
| 2:30 AM 12/16 | 0.75 | -999 |
| 2:24 AM 12/16 | 0.76 | -999 |
| 2:18 AM 12/16 | 0.78 | -999 |
| 2:12 AM 12/16 | 0.81 | -999 |
| 2:06 AM 12/16 | 0.85 | -999 |
| 2:00 AM 12/16 | 0.89 | -999 |
| 1:54 AM 12/16 | 0.95 | -999 |
| 1:48 AM 12/16 | 1 | -999 |
| 1:42 AM 12/16 | 1.04 | -999 |
| 1:36 AM 12/16 | 1.08 | -999 |
| 1:30 AM 12/16 | 1.11 | -999 |
| 1:24 AM 12/16 | 1.14 | -999 |
| 1:18 AM 12/16 | 1.17 | -999 |
| 1:12 AM 12/16 | 1.2 | -999 |
| 1:06 AM 12/16 | 1.24 | -999 |
| 1:00 AM 12/16 | 1.29 | -999 |
| 12:54 AM 12/16 | 1.33 | -999 |
| 12:48 AM 12/16 | 1.38 | -999 |
| 12:42 AM 12/16 | 1.45 | -999 |
| 12:36 AM 12/16 | 1.5 | -999 |
| 12:30 AM 12/16 | 1.57 | -999 |
| 12:24 AM 12/16 | 1.64 | -999 |
| 12:18 AM 12/16 | 1.7 | -999 |
| 12:12 AM 12/16 | 1.74 | -999 |
| 12:06 AM 12/16 | 1.78 | -999 |
| 12:00 AM 12/16 | 1.84 | -999 |
| 11:54 PM 12/15 | 1.88 | -999 |
10' -
This is a degree of flooding never experienced before. Life threatening flooding affects roads around Nantucket Harbor and in the Downtown Historic District with flooding more than 3 feet deep. Many road closures and some evacuations can be expected. Flooding also impacts the Atlantic Avenue area on the south side of the island. Large surf will also result in significant beach erosion and debris on coastal roads.
8' -
This is a degree of flooding rarely seen. Life threatening flooding more than 3 feet deep affects many roads around Nantucket Harbor and in the Downtown Historic District. Road closures and some evacuations can be expected. Flooding also impacts the Atlantic Avenue area on the south side of the island. Large surf will also result in significant beach erosion and debris on coastal roads.
7' -
Many roads near Nantucket Harbor and in the Downtown Historic District become impassable with 2 to 3 feet of water and affects access to the ferry terminals. Flooding affects Easy Street, South Beach Street, Easton Street, Walsh Street, Willard Street, and Straight Wharf.
6' -
Many roads near Nantucket Harbor become impassable with 1 to 2 feet of water and affects access to the ferry terminals. This includes Easy Street, South Beach Street, Easton Street, Walsh Street, Willard Street, and Straight Wharf.
5' -
Roads remain passable. Low lying areas and roads near Nantucket Harbor, including Easy Street, may experience pockets of shallow flooding less than one foot deep.
| Date | Stage (ft) |
|---|---|
| Oct 30, 1991 | 7.87 |
| Jan 4, 2018 | 7.36 |
| Jan 27, 2015 | 7.21 |
| Mar 3, 2018 | 6.7 |
| Dec 12, 1992 | 6.67 |
| Mar 2, 2018 | 6.62 |
| Jan 3, 2014 | 6.57 |
| Jan 13, 2024 | 6.37 |
| Jan 30, 2018 | 6.34 |
| Jan 2, 1987 | 6.34 |
| Jan 23, 2005 | 6.2 |
| Feb 9, 2013 | 6.18 |
| Mar 8, 2013 | 6.17 |
| Jan 10, 2024 | 6.16 |
| Dec 17, 2020 | 6.13 |
| Feb 6, 1978 | 6.13 |
| Mar 7, 2013 | 6.12 |
| Mar 7, 2010 | 6.11 |
| Nov 3, 2007 | 6.11 |
| Apr 3, 2020 | 6.09 |
Data provided by the National Weather Service.