« Back to Shannon County Rivers
Current River at Van Buren
Critical Stages
10' - Action
20' - Flood
23' - Moderate
27' - Major
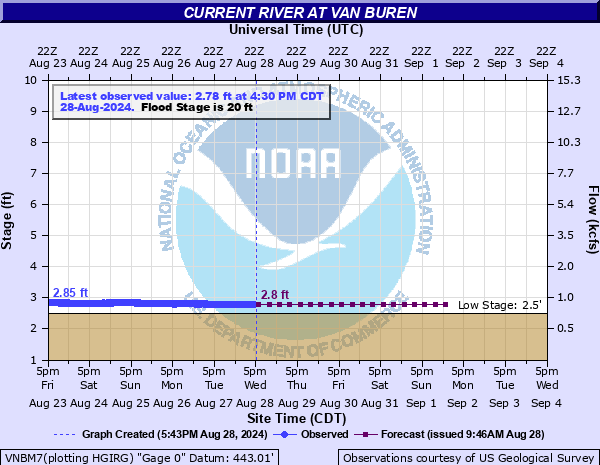
Latest Observation
Updated: 12:30 PM CST 12/6/25
Status: No Flooding
Stage: 3.2 ft
Flow: 1.29 kcfs
Forecast
| Time | Stage (ft) | Flow (kcfs) |
|---|---|---|
| 6 PM 12/6 | 3.2 | 1.29 |
| 12 AM 12/7 | 3.2 | 1.29 |
| 6 AM 12/7 | 3.2 | 1.29 |
| 12 PM 12/7 | 3.2 | 1.29 |
| 6 PM 12/7 | 3.1 | 1.2 |
| 12 AM 12/8 | 3.1 | 1.2 |
| 6 AM 12/8 | 3.1 | 1.2 |
| 12 PM 12/8 | 3.1 | 1.2 |
| 6 PM 12/8 | 3.1 | 1.2 |
| 12 AM 12/9 | 3.1 | 1.2 |
| 6 AM 12/9 | 3.1 | 1.2 |
| 12 PM 12/9 | 3.1 | 1.2 |
| 6 PM 12/9 | 3.1 | 1.2 |
| 12 AM 12/10 | 3.1 | 1.2 |
| 6 AM 12/10 | 3.1 | 1.2 |
| 12 PM 12/10 | 3.1 | 1.2 |
| 6 PM 12/10 | 3 | 1.12 |
| 12 AM 12/11 | 3 | 1.12 |
| 6 AM 12/11 | 3 | 1.12 |
| Time | Stage (ft) | Flow (kcfs) |
|---|---|---|
| 12:30 PM 12/6 | 3.2 | 1.29 |
| 12:15 PM 12/6 | 3.2 | 1.29 |
| 12:00 PM 12/6 | 3.19 | 1.28 |
| 11:45 AM 12/6 | 3.2 | 1.29 |
| 11:30 AM 12/6 | 3.2 | 1.29 |
| 11:15 AM 12/6 | 3.2 | 1.29 |
| 11:00 AM 12/6 | 3.2 | 1.29 |
| 10:45 AM 12/6 | 3.2 | 1.29 |
| 10:30 AM 12/6 | 3.19 | 1.28 |
| 10:15 AM 12/6 | 3.2 | 1.29 |
| 10:00 AM 12/6 | 3.19 | 1.28 |
| 9:45 AM 12/6 | 3.2 | 1.29 |
| 9:30 AM 12/6 | 3.2 | 1.29 |
| 9:15 AM 12/6 | 3.2 | 1.29 |
| 9:00 AM 12/6 | 3.2 | 1.29 |
| 8:45 AM 12/6 | 3.2 | 1.29 |
| 8:30 AM 12/6 | 3.2 | 1.29 |
| 8:15 AM 12/6 | 3.2 | 1.29 |
| 8:00 AM 12/6 | 3.2 | 1.29 |
| 7:45 AM 12/6 | 3.2 | 1.29 |
| 7:30 AM 12/6 | 3.2 | 1.29 |
| 7:15 AM 12/6 | 3.2 | 1.29 |
| 7:00 AM 12/6 | 3.19 | 1.28 |
| 6:45 AM 12/6 | 3.19 | 1.28 |
| 6:30 AM 12/6 | 3.2 | 1.29 |
| 6:15 AM 12/6 | 3.2 | 1.29 |
| 6:00 AM 12/6 | 3.2 | 1.29 |
| 5:45 AM 12/6 | 3.2 | 1.29 |
| 5:30 AM 12/6 | 3.2 | 1.29 |
| 5:15 AM 12/6 | 3.2 | 1.29 |
29' -
Large amounts of property damage can be expected. Evacuation of many homes and businesses becomes necessary. The courthouse yard floods.
23' -
Some flooding in low sections in town begins.
20' -
Minor flooding occurs affecting mainly bottomland and surrounding low lying areas.
18' -
The parking lot floods at WaterCress.
14.5' -
Water flows over Spring Branch Bridge.
10' -
The gravel bar at The Landing floods.
9' -
Water overflows the boat access at Big Springs.
8' -
Current river closed to non-motorized traffic.
| Date | Stage (ft) |
|---|---|
| May 1, 2017 | 37.2 |
| Mar 26, 1904 | 29 |
| Nov 15, 1993 | 27.39 |
| Nov 19, 1985 | 26.53 |
| Aug 21, 1915 | 25.9 |
| Mar 20, 2008 | 25.71 |
| Feb 24, 1985 | 24.85 |
| Dec 3, 1982 | 23.89 |
| Dec 29, 2015 | 23.12 |
| Feb 10, 1966 | 23.1 |
| Mar 11, 1935 | 22.84 |
| May 9, 2002 | 22.8 |
| Jan 30, 1969 | 22.72 |
| Nov 6, 2024 | 22.08 |
| Dec 28, 1942 | 21.66 |
| Jan 31, 1916 | 21.6 |
| Apr 26, 2011 | 21.14 |
| Apr 6, 2025 | 21 |
| Apr 18, 1945 | 20 |
Data provided by the National Weather Service.