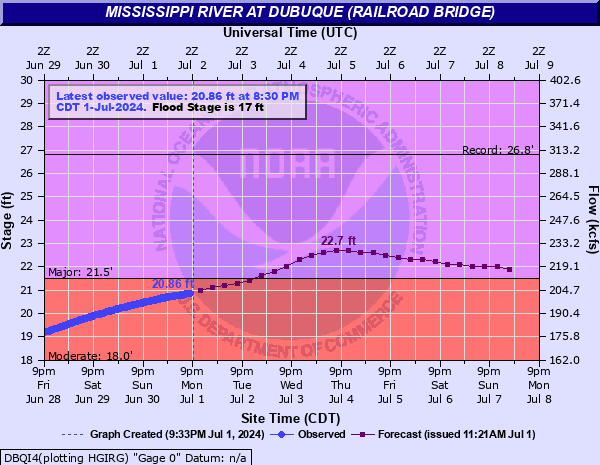
Mississippi River at Dubuque (Railroad Bridge)
Critical Stages
15' - Action
17' - Flood
18' - Moderate
21.5' - Major
Latest Observation
Updated: 7:30 PM CST 12/15/25
Status: No Flooding
Stage: 7.56 ft
Flow: 26.4 kcfs
Forecast
| Time | Stage (ft) | Flow (kcfs) |
|---|---|---|
| 12 AM 12/16 | 7.6 | 27.1 |
| 6 AM 12/16 | 7.6 | 27.1 |
| 12 PM 12/16 | 7.6 | 27.1 |
| 6 PM 12/16 | 7.5 | 25.4 |
| 12 AM 12/17 | 7.5 | 25.4 |
| 6 AM 12/17 | 7.5 | 25.4 |
| 12 PM 12/17 | 7.5 | 25.4 |
| 6 PM 12/17 | 7.5 | 25.4 |
| 12 AM 12/18 | 7.5 | 25.4 |
| 6 AM 12/18 | 7.5 | 25.4 |
| 12 PM 12/18 | 7.5 | 25.4 |
| 6 PM 12/18 | 7.5 | 25.4 |
| 12 AM 12/19 | 7.5 | 25.4 |
| 6 AM 12/19 | 7.5 | 25.4 |
| 12 PM 12/19 | 7.5 | 25.4 |
| 6 PM 12/19 | 7.5 | 25.4 |
| 12 AM 12/20 | 7.5 | 25.4 |
| 6 AM 12/20 | 7.5 | 25.4 |
| 12 PM 12/20 | 7.5 | 25.4 |
| 6 PM 12/20 | 7.5 | 25.4 |
| 12 AM 12/21 | 7.5 | 25.4 |
| 6 AM 12/21 | 7.5 | 25.4 |
| 12 PM 12/21 | 7.5 | 25.4 |
| 6 PM 12/21 | 7.4 | 23.7 |
| 12 AM 12/22 | 7.4 | 23.7 |
| 6 AM 12/22 | 7.4 | 23.7 |
| 12 PM 12/22 | 7.4 | 23.7 |
| 6 PM 12/22 | 7.4 | 23.7 |
| Time | Stage (ft) | Flow (kcfs) |
|---|---|---|
| 8:30 PM 12/15 | 7.56 | 26.4 |
| 8:15 PM 12/15 | 7.55 | 26.2 |
| 8:00 PM 12/15 | 7.56 | 26.4 |
| 7:45 PM 12/15 | 7.56 | 26.4 |
| 7:30 PM 12/15 | 7.56 | 26.4 |
| 7:15 PM 12/15 | 7.56 | 26.4 |
| 7:00 PM 12/15 | 7.56 | 26.4 |
| 6:45 PM 12/15 | 7.55 | 26.2 |
| 6:30 PM 12/15 | 7.56 | 26.4 |
| 6:15 PM 12/15 | 7.56 | 26.4 |
| 6:00 PM 12/15 | 7.56 | 26.4 |
| 5:45 PM 12/15 | 7.56 | 26.4 |
| 5:30 PM 12/15 | 7.56 | 26.4 |
| 5:15 PM 12/15 | 7.56 | 26.4 |
| 5:00 PM 12/15 | 7.56 | 26.4 |
| 4:45 PM 12/15 | 7.56 | 26.4 |
| 4:30 PM 12/15 | 7.56 | 26.4 |
| 4:15 PM 12/15 | 7.56 | 26.4 |
| 4:00 PM 12/15 | 7.56 | 26.4 |
| 3:45 PM 12/15 | 7.57 | 26.6 |
| 3:30 PM 12/15 | 7.56 | 26.4 |
| 3:15 PM 12/15 | 7.57 | 26.6 |
| 3:00 PM 12/15 | 7.56 | 26.4 |
| 2:45 PM 12/15 | 7.56 | 26.4 |
| 2:30 PM 12/15 | 7.57 | 26.6 |
| 2:15 PM 12/15 | 7.57 | 26.6 |
| 2:00 PM 12/15 | 7.57 | 26.6 |
| 1:45 PM 12/15 | 7.57 | 26.6 |
| 1:30 PM 12/15 | 7.57 | 26.6 |
| 1:15 PM 12/15 | 7.57 | 26.6 |
34.6' -
Water reaches the top of the flood wall at Kerper in Dubuque.
32' -
Water overtops the Dubuque flood wall and levee at their lowest points.
31.6' -
Water reaches the bottom of the 16th Street bridge.
28.8' -
Water reaches the bottom of the 4th Street bridge.
28.5' -
Water overtops the East Dubuque levee.
26.5' -
Water affects service buildings at Dubuque Casino. Water also reaches the top of the East Dubuque levee flood gates.
26' -
Water affects Miller Riverview Park parking lot in Dubuque.
25.5' -
Water affects the lowest sections of Dubuque Casio parking lot.
25' -
Water affects Admiral Sheehy Drive at Greyhound Park Road in Dubuque. Water also affects the Burlington Northern railroad tracks near Lock and Dam 11. Water also floods ballparks on City Island.
24' -
Water affects Dubuque Marina facilities and buildings. Water also affects Hawthorne Peninsula Park in Dubuque.
22.6' -
Water affects the Midtown Marina facilities and parking lot in East Dubuque.
21.5' -
Water affects several homes in the Frentress Lake area.
20.5' -
Water affects the Illinois Central railroad tracks in Dubuque.
20' -
Water reaches the base of the flood wall at the Ice Harbor. Most of the houses on the river side of the East Dubuque levee are in water.
18' -
Water reaches the bottom of the East Dubuque Flats levee.
17.5' -
Water affects Basten Road in East Dubuque.
17' -
Water affects homes in Shore Acres in East Dubuque.
15' -
Water affects yards in East Dubuques Shore Acres subdivision.
14' -
Water inundates the lower end of City Island. Water is at the edge of the Shore Acres subdivision and the Bent Prop Marina area in East Dubuque.
| Date | Stage (ft) |
|---|---|
| Apr 26, 1965 | 26.81 |
| Apr 21, 2001 | 25.4 |
| Apr 29, 2023 | 24.3 |
| Jul 1, 1993 | 23.84 |
| Apr 27, 2019 | 23.18 |
| Apr 23, 1969 | 23.11 |
| Apr 19, 2011 | 22.82 |
| Apr 16, 1997 | 22.8 |
| May 6, 1975 | 22.78 |
| Apr 25, 1952 | 22.7 |
| Apr 6, 2019 | 22.65 |
| Apr 22, 1951 | 22.65 |
| Jul 6, 2024 | 22.3 |
| Apr 12, 1967 | 21.86 |
| Mar 24, 1973 | 21.85 |
| Apr 11, 1967 | 21.8 |
| Oct 5, 1986 | 21.77 |
| Jun 23, 1880 | 21.7 |
| Apr 12, 1986 | 21.5 |
| May 12, 1888 | 21.4 |
Data provided by the National Weather Service.