« Back to Shoals Junction Rivers
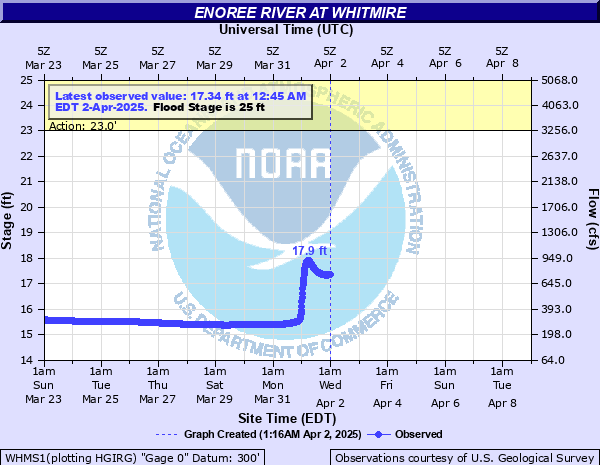
Enoree River at Whitmire
Critical Stages
23' - Action
25' - Flood
28' - Moderate
32' - Major
Latest Observation
Updated: 7:15 AM EST 12/16/25
Status: No Flooding
Stage: 14.95 ft
Flow: 0.2 kcfs
Forecast
Forecast not available for this location.
| Time | Stage (ft) | Flow (kcfs) |
|---|---|---|
| 7:15 AM 12/16 | 14.95 | 0.2 |
| 7:00 AM 12/16 | 14.95 | 0.2 |
| 6:45 AM 12/16 | 14.95 | 0.2 |
| 6:30 AM 12/16 | 14.95 | 0.2 |
| 6:15 AM 12/16 | 14.95 | 0.2 |
| 6:00 AM 12/16 | 14.95 | 0.2 |
| 5:45 AM 12/16 | 14.95 | 0.2 |
| 5:30 AM 12/16 | 14.96 | 0.202 |
| 5:15 AM 12/16 | 14.96 | 0.202 |
| 5:00 AM 12/16 | 14.96 | 0.202 |
| 4:45 AM 12/16 | 14.96 | 0.202 |
| 4:30 AM 12/16 | 14.96 | 0.202 |
| 4:15 AM 12/16 | 14.96 | 0.202 |
| 4:00 AM 12/16 | 14.96 | 0.202 |
| 3:45 AM 12/16 | 14.96 | 0.202 |
| 3:30 AM 12/16 | 14.96 | 0.202 |
| 3:15 AM 12/16 | 14.96 | 0.202 |
| 3:00 AM 12/16 | 14.96 | 0.202 |
| 2:45 AM 12/16 | 14.96 | 0.202 |
| 2:30 AM 12/16 | 14.96 | 0.202 |
| 2:15 AM 12/16 | 14.96 | 0.202 |
| 2:00 AM 12/16 | 14.96 | 0.202 |
| 1:45 AM 12/16 | 14.96 | 0.202 |
| 1:30 AM 12/16 | 14.96 | 0.202 |
| 1:15 AM 12/16 | 14.96 | 0.202 |
| 1:00 AM 12/16 | 14.96 | 0.202 |
| 12:45 AM 12/16 | 14.96 | 0.202 |
| 12:30 AM 12/16 | 14.96 | 0.202 |
| 12:15 AM 12/16 | 14.96 | 0.202 |
| 12:00 AM 12/16 | 14.96 | 0.202 |
53' -
The Highway 176 bridge becomes flooded. Traffic will have to be rerouted. Do not drive into flooded roadways.
43' -
Utility buildings near the Highway 176 bridge become flooded.
32' -
Flood water threatens to flood SC Highway 121 and US Highway 176 north of Whitmire.
28' -
The Coleman Aughtry Road along the river becomes flooded. Do not drive into flooded roadways.
25' -
River bottomland near and downstream from Whitmire become flooded.
| Date | Stage (ft) |
|---|---|
| Aug 28, 1995 | 37.32 |
| Oct 10, 1976 | 32.58 |
| Sep 29, 2024 | 32.43 |
| Feb 8, 2020 | 31.21 |
| Jan 11, 2024 | 29.84 |
| Jul 25, 1997 | 29.73 |
| Oct 13, 1990 | 29.67 |
| Oct 14, 1990 | 29.62 |
| Oct 5, 2015 | 29.08 |
| Mar 15, 1975 | 28.92 |
| Mar 22, 2003 | 28.37 |
| Apr 30, 2023 | 28 |
| Mar 3, 2007 | 27.99 |
| Mar 2, 1987 | 27.86 |
| May 24, 2003 | 27.31 |
| Nov 4, 2015 | 27.23 |
| Mar 10, 1998 | 27.19 |
| May 7, 2013 | 27.16 |
| Oct 3, 1989 | 27.02 |
| May 7, 2013 | 27.01 |
Data provided by the National Weather Service.