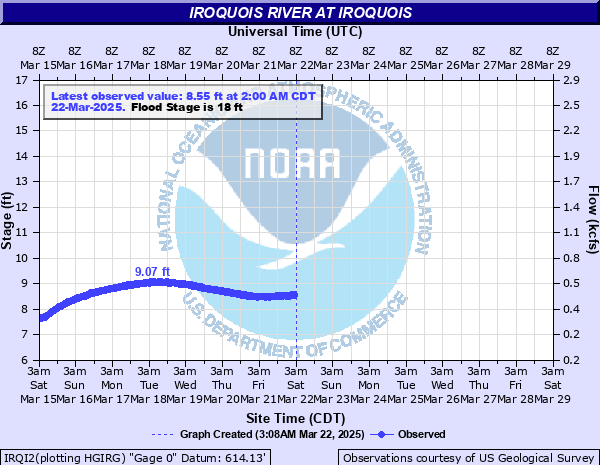
Iroquois River at Iroquois
Critical Stages
17' - Action
18' - Flood
24' - Moderate
25' - Major
Latest Observation
Updated: 3:00 PM CST 12/16/25
Status: No Flooding
Stage: 4.36 ft
Flow: 0.0617 kcfs
Forecast
Forecast not available for this location.
| Time | Stage (ft) | Flow (kcfs) |
|---|---|---|
| 3:00 PM 12/16 | 4.36 | 0.0617 |
| 2:45 PM 12/16 | 4.36 | 0.0617 |
| 2:30 PM 12/16 | 4.35 | 0.0609 |
| 2:15 PM 12/16 | 4.35 | 0.0609 |
| 2:00 PM 12/16 | 4.35 | 0.0609 |
| 1:45 PM 12/16 | 4.35 | 0.0609 |
| 1:30 PM 12/16 | 4.35 | 0.0609 |
| 1:15 PM 12/16 | 4.35 | 0.0609 |
| 11:00 AM 12/16 | 4.35 | 0.0609 |
| 10:45 AM 12/16 | 4.35 | 0.0609 |
| 10:30 AM 12/16 | 4.35 | 0.0609 |
| 10:15 AM 12/16 | 4.35 | 0.0609 |
| 10:00 AM 12/16 | 4.34 | 0.0601 |
| 9:45 AM 12/16 | 4.35 | 0.0609 |
| 9:30 AM 12/16 | 4.34 | 0.0601 |
| 9:15 AM 12/16 | 4.34 | 0.0601 |
| 9:00 AM 12/16 | 4.34 | 0.0601 |
| 8:45 AM 12/16 | 4.34 | 0.0601 |
| 8:30 AM 12/16 | 4.34 | 0.0601 |
| 8:15 AM 12/16 | 4.34 | 0.0601 |
| 8:00 AM 12/16 | 4.34 | 0.0601 |
| 7:45 AM 12/16 | 4.34 | 0.0601 |
| 7:30 AM 12/16 | 4.34 | 0.0601 |
| 7:15 AM 12/16 | 4.34 | 0.0601 |
| 7:00 AM 12/16 | 4.34 | 0.0601 |
| 6:45 AM 12/16 | 4.33 | 0.0593 |
| 6:30 AM 12/16 | 4.33 | 0.0593 |
| 6:15 AM 12/16 | 4.33 | 0.0593 |
| 6:00 AM 12/16 | 4.33 | 0.0593 |
| 5:45 AM 12/16 | 4.33 | 0.0593 |
29.6' -
Water reaches bottom of Route 52 bridge.
27' -
Residences threatened near US-52/Main Street in Iroquois.
26.5' -
US-52/Main Street threatened near the river in Iroquois.
26' -
Widespread inundation of structures and roads begins in east Watseka.
25' -
Flooding of some buildings near the river begins.
21.5' -
County Road 1950N threatened north of Watseka.
18' -
Agricultural areas near the river begin to flood.
| Date | Stage (ft) |
|---|---|
| Jun 13, 1958 | 26.31 |
| Feb 22, 2018 | 26.17 |
| Jan 9, 2008 | 25.81 |
| Jul 12, 2003 | 25.74 |
| Jun 21, 2015 | 25.27 |
| Jul 12, 2015 | 25.16 |
| Mar 11, 2009 | 24.8 |
| Dec 30, 1990 | 24.59 |
| Mar 5, 1979 | 23.81 |
| Jan 14, 2005 | 23.54 |
| Mar 13, 1990 | 23.46 |
| Oct 21, 1993 | 23.35 |
| Feb 2, 1968 | 23.35 |
| Jul 10, 1951 | 23.3 |
| Dec 29, 2015 | 23.07 |
| Jul 13, 1957 | 22.79 |
| Jun 13, 2004 | 22.74 |
| Feb 24, 1982 | 22.56 |
| Feb 13, 1959 | 22.51 |
| Feb 25, 1985 | 22.46 |
Data provided by the National Weather Service.