Missouri River at Decatur
Critical Stages
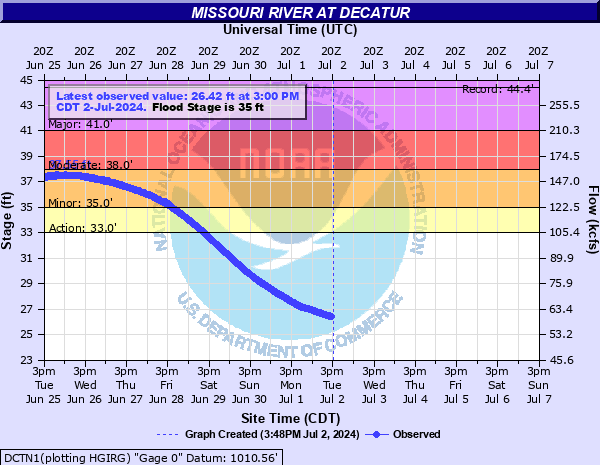
33' - Action
35' - Flood
38' - Moderate
41' - Major
Latest Observation
Updated: 4:00 AM CST 12/16/25
Status: No Flooding
Stage: 15.08 ft
Flow: 15.5 kcfs
Forecast
Forecast not available for this location.
| Time | Stage (ft) | Flow (kcfs) |
|---|---|---|
| 5:00 AM 12/16 | 15.1 | 15.5 |
| 4:45 AM 12/16 | 15.1 | 15.5 |
| 4:30 AM 12/16 | 15.08 | 15.5 |
| 4:15 AM 12/16 | 15.08 | 15.5 |
| 4:00 AM 12/16 | 15.08 | 15.5 |
| 3:45 AM 12/16 | 15.07 | 15.5 |
| 3:30 AM 12/16 | 15.07 | 15.5 |
| 3:15 AM 12/16 | 15.07 | 15.5 |
| 3:00 AM 12/16 | 15.07 | 15.5 |
| 2:45 AM 12/16 | 15.06 | 15.4 |
| 2:30 AM 12/16 | 15.07 | 15.5 |
| 2:15 AM 12/16 | 15.06 | 15.4 |
| 2:00 AM 12/16 | 15.06 | 15.4 |
| 1:45 AM 12/16 | 15.06 | 15.4 |
| 1:30 AM 12/16 | 15.06 | 15.4 |
| 1:15 AM 12/16 | 15.05 | 15.4 |
| 1:00 AM 12/16 | 15.05 | 15.4 |
| 12:45 AM 12/16 | 15.05 | 15.4 |
| 12:30 AM 12/16 | 15.05 | 15.4 |
| 12:15 AM 12/16 | 15.05 | 15.4 |
| 12:00 AM 12/16 | 15.05 | 15.4 |
| 11:45 PM 12/15 | 15.06 | 15.4 |
| 11:30 PM 12/15 | 15.06 | 15.4 |
| 11:15 PM 12/15 | 15.06 | 15.4 |
| 11:00 PM 12/15 | 15.06 | 15.4 |
| 10:45 PM 12/15 | 15.06 | 15.4 |
| 10:30 PM 12/15 | 15.06 | 15.4 |
| 10:15 PM 12/15 | 15.06 | 15.4 |
| 10:00 PM 12/15 | 15.05 | 15.4 |
| 9:45 PM 12/15 | 15.05 | 15.4 |
44' -
Widespread major flooding would be prevalent along the entire reach from just upstream of Decatur downstream to the mouth of the Little Sioux River.
38' -
Extensive flooding along the reach would be encountered. Areas impacted will include Marina Drive as well as numerous homes along the river.
35' -
Local marinas, boat docks and low lying areas begin to flood.
| Date | Stage (ft) |
|---|---|
| Apr 16, 1952 | 44.41 |
| Jul 21, 2011 | 40.24 |
| Jun 26, 2024 | 37.55 |
| Mar 17, 2019 | 36.51 |
| Sep 20, 2019 | 36.42 |
| Jun 3, 2019 | 35.72 |
| Jun 26, 1984 | 34.6 |
| Jul 18, 1996 | 32.31 |
| Jul 16, 1993 | 32.19 |
| Jun 27, 2018 | 32.18 |
| Apr 15, 1997 | 31.99 |
| Aug 6, 2010 | 31.73 |
| Jun 20, 2014 | 31.01 |
| Jun 2, 1995 | 30.1 |
| Apr 28, 2001 | 28.89 |
| Jul 22, 1999 | 28.21 |
| Jun 29, 1983 | 28.1 |
| Jun 17, 1994 | 27.7 |
| Apr 2, 2020 | 27.64 |
| Jun 26, 2000 | 26.24 |
Data provided by the National Weather Service.