Kinchafoonee Creek at Preston (SR 41)
Critical Stages
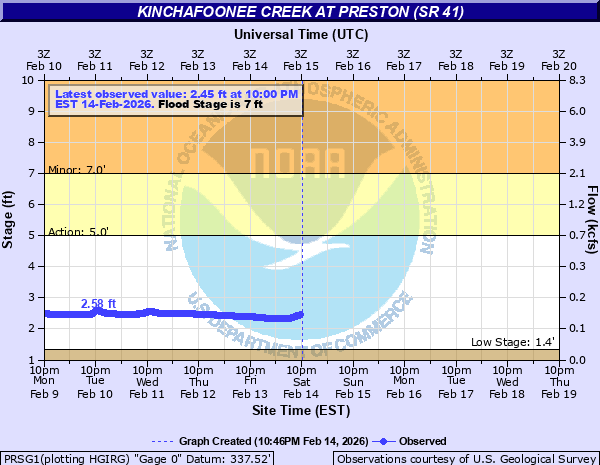
5' - Action
7' - Flood
10.5' - Moderate
14' - Major
Latest Observation
Updated: 5:00 AM EST 12/16/25
Status: No Flooding
Stage: 2.45 ft
Flow: 0.107 kcfs
Forecast
Forecast not available for this location.
| Time | Stage (ft) | Flow (kcfs) |
|---|---|---|
| 5:00 AM 12/16 | 2.45 | 0.107 |
| 4:45 AM 12/16 | 2.45 | 0.107 |
| 4:30 AM 12/16 | 2.45 | 0.107 |
| 4:15 AM 12/16 | 2.45 | 0.107 |
| 4:00 AM 12/16 | 2.45 | 0.107 |
| 3:45 AM 12/16 | 2.45 | 0.107 |
| 3:30 AM 12/16 | 2.45 | 0.107 |
| 3:15 AM 12/16 | 2.45 | 0.107 |
| 3:00 AM 12/16 | 2.46 | 0.108 |
| 2:45 AM 12/16 | 2.46 | 0.108 |
| 2:30 AM 12/16 | 2.46 | 0.108 |
| 2:15 AM 12/16 | 2.46 | 0.108 |
| 2:00 AM 12/16 | 2.46 | 0.108 |
| 1:45 AM 12/16 | 2.46 | 0.108 |
| 1:30 AM 12/16 | 2.46 | 0.108 |
| 1:15 AM 12/16 | 2.46 | 0.108 |
| 1:00 AM 12/16 | 2.47 | 0.109 |
| 12:45 AM 12/16 | 2.47 | 0.109 |
| 12:30 AM 12/16 | 2.47 | 0.109 |
| 12:15 AM 12/16 | 2.47 | 0.109 |
| 12:00 AM 12/16 | 2.47 | 0.109 |
| 11:45 PM 12/15 | 2.47 | 0.109 |
| 11:30 PM 12/15 | 2.47 | 0.109 |
| 11:15 PM 12/15 | 2.47 | 0.109 |
| 11:00 PM 12/15 | 2.48 | 0.109 |
| 10:45 PM 12/15 | 2.48 | 0.109 |
| 10:30 PM 12/15 | 2.48 | 0.109 |
| 10:15 PM 12/15 | 2.48 | 0.109 |
| 10:00 PM 12/15 | 2.48 | 0.109 |
| 9:45 PM 12/15 | 2.48 | 0.109 |
14.5' -
Flood waters reach the elevation of the gage instrument shelf.
14' -
Flood waters reach the elevation of state road 41.
13' -
Flood water will reach the underclearance of the state road 41 bridge.
12.5' -
Houses near the creek on the west bank will begin to flood.
7' -
Low lying areas and river access roads will flood.
| Date | Stage (ft) |
|---|---|
| Mar 17, 1990 | 12.16 |
| Jul 6, 1994 | 11.6 |
| Jan 15, 1943 | 11.4 |
| Jan 26, 1978 | 9.7 |
| Mar 10, 2024 | 9.03 |
| Mar 30, 1970 | 8.96 |
| Mar 28, 2005 | 8.91 |
| Dec 25, 2015 | 8.5 |
| Dec 23, 2015 | 7.82 |
| Mar 3, 1991 | 7.82 |
| Mar 5, 2020 | 7.71 |
| Feb 18, 1995 | 7.6 |
| Feb 2, 1991 | 7.6 |
| Jan 3, 2017 | 7.58 |
| Nov 27, 1992 | 7.57 |
| Mar 31, 1991 | 7.41 |
| Feb 21, 2020 | 7.4 |
| Apr 20, 2014 | 7.32 |
| Feb 4, 1996 | 7.32 |
| Dec 31, 2015 | 7.28 |
Data provided by the National Weather Service.