« Back to South Danville Rivers
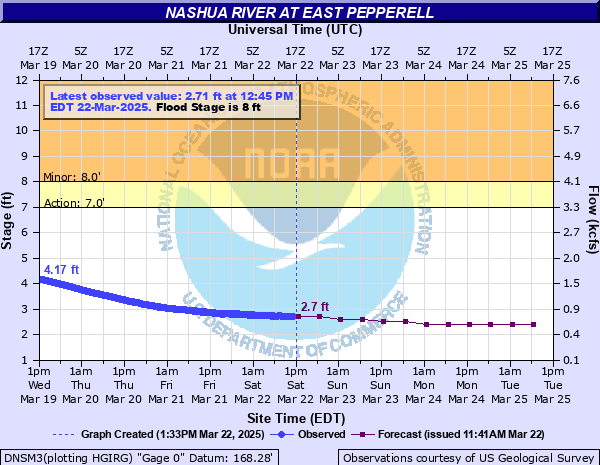
Nashua River at East Pepperell
Critical Stages
7' - Action
8' - Flood
12' - Moderate
15' - Major
Latest Observation
Updated: 9:45 PM EST 12/5/25
Status: No Flooding
Stage: 1.11 ft
Flow: 0.164 kcfs
Forecast
| Time | Stage (ft) | Flow (kcfs) |
|---|---|---|
| 1 AM 12/6 | 1.3 | 0.22 |
| 7 AM 12/6 | 1.3 | 0.22 |
| 1 PM 12/6 | 1.3 | 0.22 |
| 7 PM 12/6 | 1.3 | 0.22 |
| 1 AM 12/7 | 1.3 | 0.22 |
| 7 AM 12/7 | 1.3 | 0.22 |
| 1 PM 12/7 | 1.3 | 0.22 |
| 7 PM 12/7 | 1.3 | 0.22 |
| 1 AM 12/8 | 1.2 | 0.189 |
| 7 AM 12/8 | 1.2 | 0.189 |
| Time | Stage (ft) | Flow (kcfs) |
|---|---|---|
| 9:45 PM 12/5 | 1.11 | 0.164 |
| 9:30 PM 12/5 | 1.11 | 0.164 |
| 9:15 PM 12/5 | 1.11 | 0.164 |
| 9:00 PM 12/5 | 1.11 | 0.164 |
| 8:45 PM 12/5 | 1.11 | 0.164 |
| 8:30 PM 12/5 | 1.11 | 0.164 |
| 8:15 PM 12/5 | 1.11 | 0.164 |
| 8:00 PM 12/5 | 1.11 | 0.164 |
| 7:45 PM 12/5 | 1.12 | 0.166 |
| 7:30 PM 12/5 | 1.12 | 0.166 |
| 7:15 PM 12/5 | 1.11 | 0.164 |
| 7:00 PM 12/5 | 1.11 | 0.164 |
| 6:45 PM 12/5 | 1.11 | 0.164 |
| 6:30 PM 12/5 | 1.11 | 0.164 |
| 6:15 PM 12/5 | 1.11 | 0.164 |
| 6:00 PM 12/5 | 1.11 | 0.164 |
| 5:45 PM 12/5 | 1.11 | 0.164 |
| 5:30 PM 12/5 | 1.11 | 0.164 |
| 5:15 PM 12/5 | 1.11 | 0.164 |
| 5:00 PM 12/5 | 1.11 | 0.164 |
| 4:45 PM 12/5 | 1.11 | 0.164 |
| 4:30 PM 12/5 | 1.11 | 0.164 |
| 4:15 PM 12/5 | 1.11 | 0.164 |
| 4:00 PM 12/5 | 1.11 | 0.164 |
| 3:45 PM 12/5 | 1.11 | 0.164 |
| 3:30 PM 12/5 | 1.11 | 0.164 |
| 3:15 PM 12/5 | 1.11 | 0.164 |
| 3:00 PM 12/5 | 1.12 | 0.166 |
| 2:45 PM 12/5 | 1.12 | 0.166 |
| 2:30 PM 12/5 | 1.12 | 0.166 |
16' -
Widespread inundation of residential areas along the Nashua River is likely. Areas that will be the most impacted include parts of East Pepperell, Hollis and Nashua. Flooding is expected along a stretch of Route 119 in Pepperell. In Groton, potentially affected areas include Fitchs Bridge Road, Long Hill Road, and Route 225. Take action now to protect life and property. Follow the directions of emergency management officials. The standard river gage does not report at this elevation.
15' -
Flooding is expected in low lying residential areas along portions of the Nashua River. Floodwaters inundate a Pepperell Airport as well as low lying areas on route 119. Know the alternate routes in your location so you avoid areas where flood waters may have damaged or closed area roadways. Follow the directions of local officials and if asked to evacuate do so immediately. The standard river gage can not report much higher than this elevation
14' -
Flooding is expected in low lying residential areas along portions of the Nashua River. Floodwaters inundate a portion of Route 119 in Pepperell, and also inundate businesses on Route 119 near its junction with Route 111. Know the alternate routes in your location so you avoid areas where flood waters may have damaged or closed area roadways. Follow the directions of local officials and if asked to evacuate do so immediately. The standard river gage can not report much higher than this elevation.
12' -
Flooding is expected in low lying residential areas along portions of the Nashua River. Floodwaters inundate a portion of Route 119 in Pepperell, and also inundate businesses on Route 119 near its junction with Route 111. Know the alternate routes in your location so you avoid areas where flood waters may have damaged or closed area roadways.
11' -
Flooding is expected in low lying residential areas along portions of the Nashua River. Follow the directions provided by your local emergency management officials. Avoid flood prone locations. Know the alternate routes in your location so you avoid areas where flood waters may have damaged or closed area roadways.
10' -
Minor lowland flooding is likely along the river from East Pepperell downstream through Hollis. Flooding will impact some low lying businesses along Route 119 in Pepperell in the vicinity of Route 111.
9' -
Minor lowland flooding is likely along the river from East Pepperell downstream through Hollis. Flooding will impact low lying businesses along Route 119 in Pepperell in the vicinity of its junction with Route 111.
8' -
Minor lowland flooding is likely along the river from East Pepperell downstream through Hollis.
| Date | Stage (ft) |
|---|---|
| Mar 20, 1936 | 19.1 |
| Apr 7, 1987 | 16.19 |
| Mar 17, 2010 | 15.75 |
| Sep 23, 1938 | 14.08 |
| Apr 1, 2010 | 13.78 |
| Apr 18, 2007 | 13.1 |
| Jun 26, 1944 | 11.86 |
| Mar 20, 1968 | 11.77 |
| Jun 2, 1984 | 11.73 |
| Jun 8, 1982 | 11.4 |
| Oct 17, 1956 | 11.02 |
| Apr 3, 2004 | 10.81 |
| Apr 6, 1960 | 10.75 |
| Mar 8, 1979 | 10.56 |
| Feb 28, 2010 | 10.38 |
| Apr 18, 1996 | 10.26 |
| Oct 22, 1996 | 10.16 |
| Apr 1, 1993 | 10.1 |
| Apr 3, 1962 | 9.95 |
| Mar 21, 1983 | 9.88 |
Data provided by the National Weather Service.