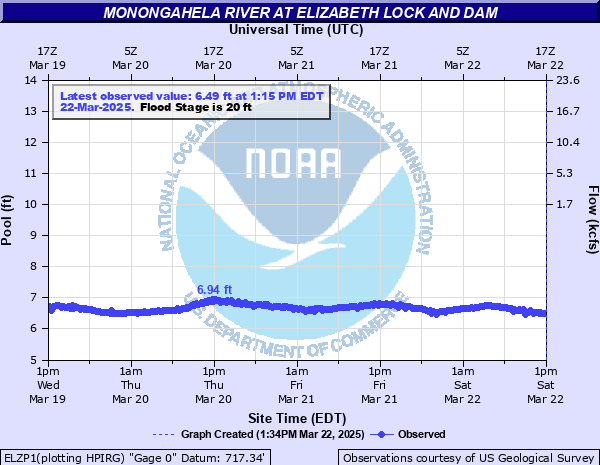
Monongahela River at Elizabeth Lock and Dam
Critical Stages
16.5' - Action
20' - Flood
23' - Moderate
26' - Major
Latest Observation
Updated: 11:15 AM EST 12/6/25
Status: No Flooding
Stage: 7.54 ft
Flow: -999 kcfs
Forecast
Forecast not available for this location.
| Time | Stage (ft) | Flow (kcfs) |
|---|---|---|
| 11:15 AM 12/6 | 7.54 | -999 |
| 11:00 AM 12/6 | 7.56 | -999 |
| 10:45 AM 12/6 | 7.59 | -999 |
| 10:30 AM 12/6 | 7.47 | -999 |
| 10:15 AM 12/6 | 7.5 | -999 |
| 10:00 AM 12/6 | 7.73 | -999 |
| 9:45 AM 12/6 | 7.76 | -999 |
| 9:30 AM 12/6 | 7.51 | -999 |
| 9:15 AM 12/6 | 7.48 | -999 |
| 9:00 AM 12/6 | 7.51 | -999 |
| 8:45 AM 12/6 | 7.75 | -999 |
| 8:30 AM 12/6 | 7.69 | -999 |
| 8:15 AM 12/6 | 7.63 | -999 |
| 8:00 AM 12/6 | 7.8 | -999 |
| 7:45 AM 12/6 | 7.72 | -999 |
| 7:30 AM 12/6 | 7.63 | -999 |
| 7:15 AM 12/6 | 7.76 | -999 |
| 7:00 AM 12/6 | 7.76 | -999 |
| 6:45 AM 12/6 | 7.79 | -999 |
| 6:30 AM 12/6 | 7.55 | -999 |
| 6:15 AM 12/6 | 7.76 | -999 |
| 6:00 AM 12/6 | 7.71 | -999 |
| 5:45 AM 12/6 | 7.74 | -999 |
| 5:30 AM 12/6 | 7.81 | -999 |
| 5:15 AM 12/6 | 7.75 | -999 |
| 5:00 AM 12/6 | 7.52 | -999 |
| 4:45 AM 12/6 | 7.86 | -999 |
| 4:30 AM 12/6 | 7.6 | -999 |
| 4:15 AM 12/6 | 7.82 | -999 |
| 4:00 AM 12/6 | 7.81 | -999 |
32' -
Elizabeth immediately downstream of Lock 3 floods.
30.5' -
Water Street, First Street and Second Street in West Elizabeth flood. Flood waters are 4 to 5 feet deep in homes along Water Street.
27' -
Serious damage to homes and industries in West Elizabeth. Many roads flood.
25.6' -
Water reaches the first floor of numerous homes from the intersection of First and Border Streets north to the intersection of Mill and First streets in West Elizabeth.
24.05' -
Water levels reach the flood levels of the flood of July 30, 2017.
23' -
Industrial Chemical Corporation plant floods.
22' -
In West Elizabeth basements of numerous homes in the block bounded by First and Water streets begin to flood.
20' -
Small communities around Lock 3 area begin minor flooding.
18.1' -
Lock walls overtopped.
17.5' -
Navigation suspended, lock out of service.
| Date | Stage (ft) |
|---|---|
| Mar 18, 1936 | 32.5 |
| Nov 6, 1985 | 31.6 |
| Jan 20, 1996 | 30.3 |
| Jun 24, 1972 | 29 |
| Oct 16, 1954 | 28.5 |
| Mar 7, 1967 | 28.3 |
| Feb 19, 2000 | 27.6 |
| Apr 16, 2007 | 26.77 |
| Mar 6, 1963 | 26.5 |
| May 25, 1968 | 25.6 |
| Dec 30, 1942 | 24.8 |
| Nov 20, 2003 | 24.7 |
| Apr 4, 2024 | 24.54 |
| Feb 17, 2018 | 24.53 |
| Jan 12, 1974 | 24.4 |
| Jul 30, 2017 | 24.05 |
| Jan 27, 1978 | 23.9 |
| Mar 5, 2015 | 23.77 |
| Feb 10, 1994 | 23.7 |
| Mar 20, 1963 | 23.6 |
Data provided by the National Weather Service.