Withlacoochee River at US 41 Dunnellon (in NAVD88)
Critical Stages
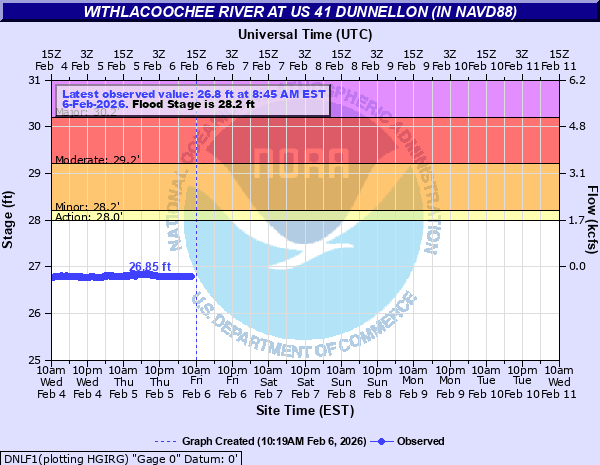
28' - Action
28.2' - Flood
29.2' - Moderate
30.2' - Major
Latest Observation
Updated: 12:45 AM EST 12/11/25
Status: No Flooding
Stage: 26.76 ft
Flow: -999 kcfs
Forecast
Forecast not available for this location.
| Time | Stage (ft) | Flow (kcfs) |
|---|---|---|
| 12:45 AM 12/11 | 26.76 | -999 |
| 12:30 AM 12/11 | 26.76 | -999 |
| 12:15 AM 12/11 | 26.76 | -999 |
| 12:00 AM 12/11 | 26.76 | -999 |
| 11:45 PM 12/10 | 26.76 | -999 |
| 11:30 PM 12/10 | 26.76 | -999 |
| 11:15 PM 12/10 | 26.76 | -999 |
| 11:00 PM 12/10 | 26.76 | -999 |
| 10:45 PM 12/10 | 26.76 | -999 |
| 10:30 PM 12/10 | 26.76 | -999 |
| 10:15 PM 12/10 | 26.76 | -999 |
| 10:00 PM 12/10 | 26.75 | -999 |
| 9:45 PM 12/10 | 26.76 | -999 |
| 9:30 PM 12/10 | 26.76 | -999 |
| 9:15 PM 12/10 | 26.76 | -999 |
| 9:00 PM 12/10 | 26.76 | -999 |
| 8:45 PM 12/10 | 26.76 | -999 |
| 8:30 PM 12/10 | 26.76 | -999 |
| 8:15 PM 12/10 | 26.76 | -999 |
| 8:00 PM 12/10 | 26.76 | -999 |
| 7:45 PM 12/10 | 26.76 | -999 |
| 7:30 PM 12/10 | 26.76 | -999 |
| 7:15 PM 12/10 | 26.76 | -999 |
| 7:00 PM 12/10 | 26.76 | -999 |
| 6:45 PM 12/10 | 26.76 | -999 |
| 6:30 PM 12/10 | 26.77 | -999 |
| 6:15 PM 12/10 | 26.77 | -999 |
| 6:00 PM 12/10 | 26.77 | -999 |
| 5:45 PM 12/10 | 26.77 | -999 |
| 5:30 PM 12/10 | 26.77 | -999 |
36.7' -
Water reaches the base of the US-41 bridge.
31.2' -
In Marion county, water begins to flood areas between the river and the railroad west of Mary Street. In Citrus county, flooding expands over a large area north of West Dunnellon Road and the river.
30.2' -
In Citrus county, flooding expands to include West Dupage Drive and areas between the river at West Martin Luther King Lane.
29.2' -
In Citrus county, water overflows into areas along West Dupage Trail and North Waterway, affecting structures not elevated.
28.2' -
Docks and boat ramps flood along the river in Citrus and Marion counties.
| Date | Stage (ft) |
|---|---|
| Apr 1, 1960 | 32.2 |
| Oct 12, 1961 | 30.8 |
| Jul 17, 1934 | 30.65 |
| Sep 27, 2004 | 29.61 |
| Nov 2, 2024 | 29.01 |
| Mar 20, 1998 | 28.9 |
| Sep 12, 1964 | 28.84 |
| Jan 20, 1998 | 28.8 |
| Aug 9, 2003 | 28.74 |
| Oct 8, 2017 | 28.6 |
| Oct 12, 1995 | 28.46 |
| Aug 25, 2008 | 28.41 |
| Aug 5, 2024 | 28.35 |
| Jul 4, 2003 | 28.33 |
| Oct 5, 1965 | 28.3 |
| Aug 6, 1974 | 28.3 |
| Jun 29, 2003 | 28.24 |
| Sep 16, 1971 | 28.23 |
| Oct 2, 1979 | 28.22 |
Data provided by the National Weather Service.