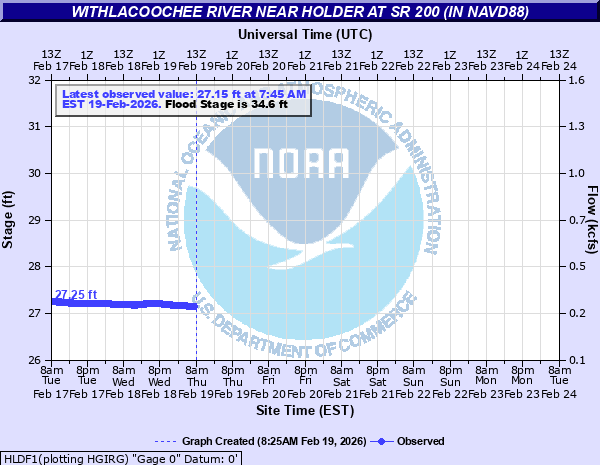
Withlacoochee River near Holder at SR 200 (in NAVD88)
Critical Stages
33.6' - Action
34.6' - Flood
35.6' - Moderate
37.6' - Major
Latest Observation
Updated: 12:45 AM EST 12/11/25
Status: No Flooding
Stage: 27.24 ft
Flow: 0.258 kcfs
Forecast
Forecast not available for this location.
| Time | Stage (ft) | Flow (kcfs) |
|---|---|---|
| 12:45 AM 12/11 | 27.24 | 0.258 |
| 12:30 AM 12/11 | 27.24 | 0.258 |
| 12:15 AM 12/11 | 27.24 | 0.258 |
| 12:00 AM 12/11 | 27.24 | 0.258 |
| 11:45 PM 12/10 | 27.24 | 0.258 |
| 11:30 PM 12/10 | 27.24 | 0.258 |
| 11:15 PM 12/10 | 27.24 | 0.258 |
| 11:00 PM 12/10 | 27.24 | 0.258 |
| 10:45 PM 12/10 | 27.24 | 0.258 |
| 10:30 PM 12/10 | 27.24 | 0.258 |
| 10:15 PM 12/10 | 27.24 | 0.258 |
| 10:00 PM 12/10 | 27.24 | 0.258 |
| 9:45 PM 12/10 | 27.25 | 0.261 |
| 9:30 PM 12/10 | 27.25 | 0.261 |
| 9:15 PM 12/10 | 27.25 | 0.261 |
| 9:00 PM 12/10 | 27.25 | 0.261 |
| 8:45 PM 12/10 | 27.25 | 0.261 |
| 8:30 PM 12/10 | 27.25 | 0.261 |
| 8:15 PM 12/10 | 27.25 | 0.261 |
| 8:00 PM 12/10 | 27.25 | 0.261 |
| 7:45 PM 12/10 | 27.25 | 0.261 |
| 7:30 PM 12/10 | 27.25 | 0.261 |
| 7:15 PM 12/10 | 27.25 | 0.261 |
| 7:00 PM 12/10 | 27.25 | 0.261 |
| 6:45 PM 12/10 | 27.25 | 0.261 |
| 6:30 PM 12/10 | 27.26 | 0.264 |
| 6:15 PM 12/10 | 27.26 | 0.264 |
| 6:00 PM 12/10 | 27.25 | 0.261 |
| 5:45 PM 12/10 | 27.26 | 0.264 |
| 5:30 PM 12/10 | 27.26 | 0.264 |
40.7' -
Water reaches the base of the SR-200 bridge.
37.6' -
In Citrus county, flooding is extensive throughout the Arrowhead subdivision. Flooding is also extensive west of SR-200 along East Withlacoochee Trail.
35.6' -
In Citrus county, Arrowhead subdivision floods with water in homes, especially between the river and north of East Forest Trail Drive.
34.6' -
In Citrus county, water approaches house foundations in Arrowhead subdivision...especially along East River Road, North Rio Robel Point, and North Spring Run Terrace.
| Date | Stage (ft) |
|---|---|
| Apr 5, 1960 | 39.89 |
| Oct 10, 1960 | 38.66 |
| Jul 8, 1934 | 38.24 |
| Oct 13, 2004 | 37.86 |
| Sep 26, 1933 | 37.78 |
| Nov 1, 2024 | 37.58 |
| Mar 21, 1998 | 37.19 |
| Aug 19, 1945 | 37.15 |
| Jan 20, 1998 | 37.11 |
| Oct 9, 1953 | 37.07 |
| Sep 23, 1950 | 37.01 |
| Sep 30, 1949 | 36.95 |
| Apr 7, 1959 | 36.56 |
| Aug 25, 2003 | 36.51 |
| Sep 2, 1948 | 36.1 |
| Oct 13, 1979 | 36.06 |
| Oct 10, 2017 | 35.99 |
| Oct 4, 1964 | 35.83 |
| Oct 11, 1947 | 35.51 |
| Sep 28, 1935 | 35.47 |
Data provided by the National Weather Service.