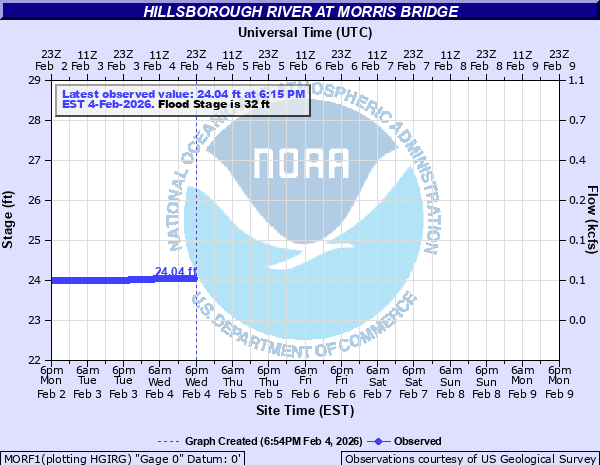
Hillsborough River at Morris Bridge
Critical Stages
30.5' - Action
32' - Flood
34' - Moderate
36' - Major
Latest Observation
Updated: 1:00 AM EST 12/11/25
Status: No Flooding
Stage: 25.33 ft
Flow: 0.171 kcfs
Forecast
Forecast not available for this location.
| Time | Stage (ft) | Flow (kcfs) |
|---|---|---|
| 1:15 AM 12/11 | 25.33 | 0.171 |
| 1:00 AM 12/11 | 25.33 | 0.171 |
| 12:45 AM 12/11 | 25.33 | 0.171 |
| 12:30 AM 12/11 | 25.33 | 0.171 |
| 12:15 AM 12/11 | 25.33 | 0.171 |
| 12:00 AM 12/11 | 25.33 | 0.171 |
| 11:45 PM 12/10 | 25.33 | 0.171 |
| 11:30 PM 12/10 | 25.33 | 0.171 |
| 11:15 PM 12/10 | 25.33 | 0.171 |
| 11:00 PM 12/10 | 25.33 | 0.171 |
| 10:45 PM 12/10 | 25.33 | 0.171 |
| 10:30 PM 12/10 | 25.33 | 0.171 |
| 10:15 PM 12/10 | 25.33 | 0.171 |
| 10:00 PM 12/10 | 25.33 | 0.171 |
| 9:45 PM 12/10 | 25.33 | 0.171 |
| 9:30 PM 12/10 | 25.33 | 0.171 |
| 9:15 PM 12/10 | 25.33 | 0.171 |
| 9:00 PM 12/10 | 25.33 | 0.171 |
| 8:45 PM 12/10 | 25.33 | 0.171 |
| 8:30 PM 12/10 | 25.33 | 0.171 |
| 8:15 PM 12/10 | 25.33 | 0.171 |
| 8:00 PM 12/10 | 25.33 | 0.171 |
| 7:45 PM 12/10 | 25.33 | 0.171 |
| 7:30 PM 12/10 | 25.33 | 0.171 |
| 7:15 PM 12/10 | 25.33 | 0.171 |
| 7:00 PM 12/10 | 25.33 | 0.171 |
| 6:45 PM 12/10 | 25.33 | 0.171 |
| 6:30 PM 12/10 | 25.33 | 0.171 |
| 6:15 PM 12/10 | 25.33 | 0.171 |
| 6:00 PM 12/10 | 25.33 | 0.171 |
35' -
Portions of Morris Bridge road about 3/4 of a mile south of the bridge begin to flood.
32' -
Flooding begins at a trailer park downstream from Morris Bridge and just upstream from the northern end of the Tampa Bypass canal.
| Date | Stage (ft) |
|---|---|
| Sep 14, 2017 | 34.66 |
| Sep 8, 2004 | 34.38 |
| Dec 15, 1997 | 34.27 |
| Sep 9, 1988 | 34.15 |
| Dec 29, 1997 | 33.92 |
| Apr 2, 1987 | 33.31 |
| Sep 6, 1985 | 32.75 |
| Oct 1, 1979 | 32.74 |
| Aug 5, 2015 | 32.47 |
| Sep 30, 2004 | 32.45 |
| Dec 16, 2002 | 32.3 |
| Aug 14, 1965 | 32.22 |
| Aug 8, 2024 | 32 |
Data provided by the National Weather Service.