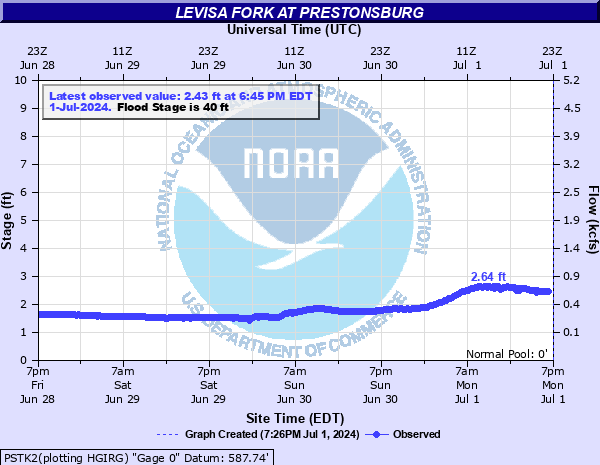
Levisa Fork at Prestonsburg
Critical Stages
22' - Action
40' - Flood
43' - Moderate
46' - Major
Latest Observation
Updated: 6:45 AM EST 12/17/25
Status: No Flooding
Stage: 2.38 ft
Flow: 0.574 kcfs
Forecast
Forecast not available for this location.
| Time | Stage (ft) | Flow (kcfs) |
|---|---|---|
| 6:45 AM 12/17 | 2.38 | 0.574 |
| 6:30 AM 12/17 | 2.38 | 0.574 |
| 6:15 AM 12/17 | 2.39 | 0.578 |
| 6:00 AM 12/17 | 2.39 | 0.578 |
| 5:45 AM 12/17 | 2.39 | 0.578 |
| 5:30 AM 12/17 | 2.4 | 0.583 |
| 5:15 AM 12/17 | 2.4 | 0.583 |
| 5:00 AM 12/17 | 2.4 | 0.583 |
| 4:45 AM 12/17 | 2.4 | 0.583 |
| 4:30 AM 12/17 | 2.4 | 0.583 |
| 4:15 AM 12/17 | 2.4 | 0.583 |
| 4:00 AM 12/17 | 2.41 | 0.587 |
| 3:45 AM 12/17 | 2.41 | 0.587 |
| 3:30 AM 12/17 | 2.42 | 0.592 |
| 3:15 AM 12/17 | 2.41 | 0.587 |
| 3:00 AM 12/17 | 2.42 | 0.592 |
| 2:45 AM 12/17 | 2.42 | 0.592 |
| 2:30 AM 12/17 | 2.43 | 0.596 |
| 2:15 AM 12/17 | 2.43 | 0.596 |
| 2:00 AM 12/17 | 2.43 | 0.596 |
| 1:45 AM 12/17 | 2.43 | 0.596 |
| 1:30 AM 12/17 | 2.43 | 0.596 |
| 1:15 AM 12/17 | 2.44 | 0.601 |
| 1:00 AM 12/17 | 2.44 | 0.601 |
| 12:45 AM 12/17 | 2.45 | 0.605 |
| 12:30 AM 12/17 | 2.45 | 0.605 |
| 12:15 AM 12/17 | 2.45 | 0.605 |
| 12:00 AM 12/17 | 2.45 | 0.605 |
| 11:45 PM 12/16 | 2.45 | 0.605 |
| 11:30 PM 12/16 | 2.46 | 0.61 |
49.9' -
Flooding will equal the highest flood on record.
48' -
The entire town is flooded except for portions of Riverside Avenue and a half block on Mill Street.
47' -
Water reaches the top of the levee.
46' -
Major flooding is occurring. Most of town is flooded except for the center of city which is protected by a levee and small area near hills.
43' -
Moderate flooding occurs. Water enters some homes.
41' -
Water is in the business district including the court house and old post office.
40' -
Minor flooding. River is at flood stage and is 430 feet wide.
27' -
Flood gate is closed to the storm drain system in Prestonsburg.
24' -
Archer Park is inundated.
| Date | Stage (ft) |
|---|---|
| Jan 30, 1957 | 48.78 |
| Feb 1, 1862 | 47.9 |
| Mar 12, 1963 | 46.6 |
| Apr 6, 1977 | 45.71 |
| Jan 29, 1918 | 45.3 |
| May 7, 1984 | 43.88 |
| Mar 23, 1929 | 43.8 |
| Feb 17, 2025 | 43.37 |
| Feb 5, 1939 | 41.83 |
| Mar 1, 1955 | 41.51 |
| Mar 2, 2021 | 40.5 |
| Mar 8, 1967 | 40.02 |
| Feb 17, 2003 | 39.88 |
Data provided by the National Weather Service.