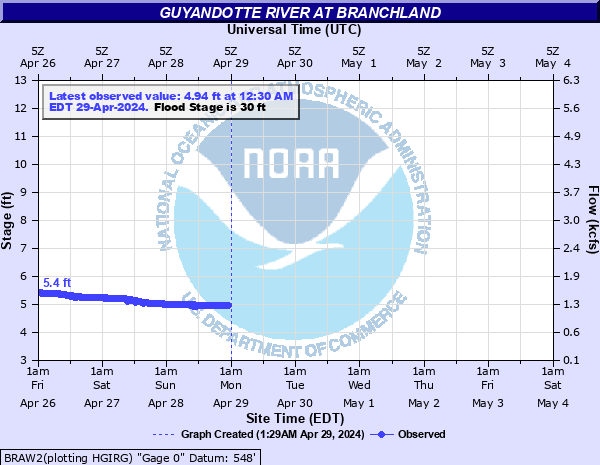
Guyandotte River at Branchland
Critical Stages
26' - Action
30' - Flood
35' - Moderate
40' - Major
Latest Observation
Updated: 2:30 AM EST 12/5/25
Status: No Flooding
Stage: 5.17 ft
Flow: 1.36 kcfs
Forecast
Forecast not available for this location.
| Time | Stage (ft) | Flow (kcfs) |
|---|---|---|
| 2:30 AM 12/5 | 5.17 | 1.36 |
| 2:15 AM 12/5 | 5.18 | 1.37 |
| 2:00 AM 12/5 | 5.17 | 1.36 |
| 1:45 AM 12/5 | 5.18 | 1.37 |
| 1:30 AM 12/5 | 5.18 | 1.37 |
| 1:15 AM 12/5 | 5.18 | 1.37 |
| 1:00 AM 12/5 | 5.19 | 1.37 |
| 12:45 AM 12/5 | 5.18 | 1.37 |
| 12:30 AM 12/5 | 5.19 | 1.37 |
| 12:15 AM 12/5 | 5.19 | 1.37 |
| 12:00 AM 12/5 | 5.19 | 1.37 |
| 11:45 PM 12/4 | 5.19 | 1.37 |
| 11:30 PM 12/4 | 5.19 | 1.37 |
| 11:15 PM 12/4 | 5.19 | 1.37 |
| 11:00 PM 12/4 | 5.19 | 1.37 |
| 10:45 PM 12/4 | 5.19 | 1.37 |
| 10:30 PM 12/4 | 5.2 | 1.38 |
| 10:15 PM 12/4 | 5.2 | 1.38 |
| 10:00 PM 12/4 | 5.2 | 1.38 |
| 9:45 PM 12/4 | 5.2 | 1.38 |
| 9:30 PM 12/4 | 5.21 | 1.39 |
| 9:15 PM 12/4 | 5.21 | 1.39 |
| 9:00 PM 12/4 | 5.21 | 1.39 |
| 8:45 PM 12/4 | 5.21 | 1.39 |
| 8:30 PM 12/4 | 5.21 | 1.39 |
| 8:15 PM 12/4 | 5.22 | 1.39 |
| 8:00 PM 12/4 | 5.22 | 1.39 |
| 7:45 PM 12/4 | 5.22 | 1.39 |
| 7:30 PM 12/4 | 5.22 | 1.39 |
| 7:15 PM 12/4 | 5.22 | 1.39 |
43' -
Major flooding is occurring. Several roads and homes are flooded throughout the area between West Hamlin, Branchland, Midkiff and Ranger.
40' -
Several roads, homes, and businesses are flooded throughout the area between West Hamlin, Branchland, Midkiff and Ranger.
35' -
Several roads along the Guyandotte River between West Hamlin and Ranger are flooded.
30' -
Payton Branch, Nine Mile Creek, Four Mile Creek and Hamilton Creek Roads are flooded. Esquire Drive and portions of Health Creek Road are flooded.
28' -
Payton Branch, Nine Mile Creek, Four Mile Creek, and Hamilton Creek Roads begin to flood.
27' -
Esquire Drive and portions of Health Creek Road begin to flood.
| Date | Stage (ft) |
|---|---|
| Jan 1, 1907 | 44 |
| Mar 13, 1963 | 43.83 |
| Mar 1, 1955 | 42.57 |
| Mar 8, 1967 | 42.26 |
| Jan 30, 1957 | 41.88 |
| Jan 13, 1974 | 41.59 |
| Feb 27, 1972 | 40.95 |
| Jan 29, 1918 | 39.24 |
| Apr 6, 1977 | 39.09 |
| Apr 26, 1977 | 39.09 |
| Feb 28, 1962 | 38.93 |
| Feb 14, 1948 | 38.85 |
| Mar 7, 1955 | 38.78 |
| Feb 4, 1939 | 38.6 |
| Jun 24, 1979 | 38.2 |
| Feb 3, 1950 | 37.4 |
| Jan 1, 1970 | 36.86 |
| Feb 17, 2003 | 36.72 |
| Mar 2, 2021 | 36.29 |
| Dec 31, 1942 | 36.23 |
Data provided by the National Weather Service.