« Back to Stillman Valley Rivers
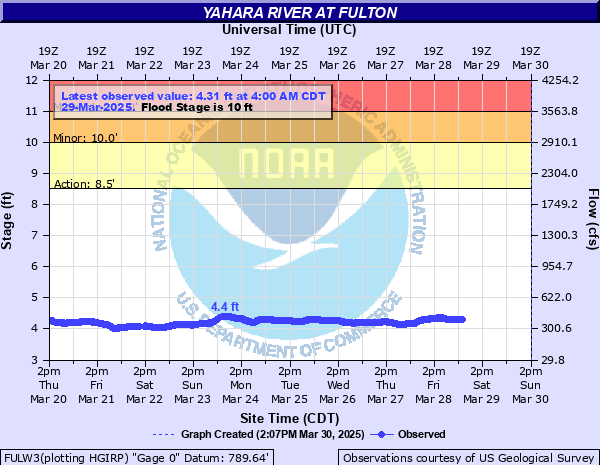
Yahara River at Fulton
Critical Stages
8.5' - Action
10' - Flood
11' - Moderate
12' - Major
Latest Observation
Updated: 1:00 AM CST 12/15/25
Status: No Flooding
Stage: 4.22 ft
Flow: 0.306 kcfs
Forecast
Forecast not available for this location.
| Time | Stage (ft) | Flow (kcfs) |
|---|---|---|
| 1:00 AM 12/15 | 4.22 | 0.306 |
| 12:45 AM 12/15 | 4.23 | 0.309 |
| 12:30 AM 12/15 | 4.24 | 0.312 |
| 12:15 AM 12/15 | 4.25 | 0.315 |
| 12:00 AM 12/15 | 4.26 | 0.318 |
| 11:45 PM 12/14 | 4.27 | 0.321 |
| 11:30 PM 12/14 | 4.29 | 0.327 |
| 11:15 PM 12/14 | 4.32 | 0.336 |
| 11:00 PM 12/14 | 4.36 | 0.347 |
| 10:45 PM 12/14 | 4.39 | 0.356 |
| 10:30 PM 12/14 | 4.41 | 0.362 |
| 10:15 PM 12/14 | 4.43 | 0.368 |
| 10:00 PM 12/14 | 4.45 | 0.374 |
| 9:45 PM 12/14 | 4.46 | 0.377 |
| 9:30 PM 12/14 | 4.47 | 0.38 |
| 9:15 PM 12/14 | 4.49 | 0.386 |
| 9:00 PM 12/14 | 4.52 | 0.395 |
| 8:45 PM 12/14 | 4.53 | 0.398 |
| 8:30 PM 12/14 | 4.55 | 0.405 |
| 8:15 PM 12/14 | 4.59 | 0.418 |
| 8:00 PM 12/14 | 4.65 | 0.437 |
| 7:45 PM 12/14 | 4.71 | 0.457 |
| 7:30 PM 12/14 | 4.78 | 0.48 |
| 7:15 PM 12/14 | 4.83 | 0.497 |
| 7:00 PM 12/14 | 4.89 | 0.518 |
| 6:45 PM 12/14 | 4.96 | 0.542 |
| 6:30 PM 12/14 | 5.04 | 0.569 |
| 6:15 PM 12/14 | 5.15 | 0.604 |
| 6:00 PM 12/14 | 5.32 | 0.661 |
| 5:45 PM 12/14 | 5.52 | 0.728 |
12.94' -
There is widespread flooding of lowland and agricultural land. A small park in Fulton is flooded and closed.
11.72' -
There is widespread flooding of lowland and agricultural land. A small park in Fulton is flooded and closed.
10' -
There is extensive flooding of agricultural land. A small park is flooded in Fulton.
9.5' -
There is lowland and agricultural land flooding.
9' -
Flooding effects are mainly confined to lowland and agricultural land.
8.5' -
There is minor lowland flooding
7.5' -
Flooding effects are confined mainly to lowland.
| Date | Stage (ft) |
|---|---|
| Jun 26, 2013 | 12.07 |
| Feb 20, 2018 | 11.33 |
| Jun 18, 1996 | 11.16 |
| Mar 14, 2019 | 11 |
| Oct 2, 2018 | 10.14 |
| May 23, 2004 | 10.02 |
| Jun 14, 2008 | 9.87 |
| Aug 20, 2007 | 9.68 |
| May 17, 1999 | 9.62 |
| Mar 25, 2009 | 9.3 |
| Jun 1, 2000 | 9.13 |
| Feb 21, 1997 | 8.81 |
| Oct 2, 2019 | 8.69 |
| Jul 14, 2024 | 8.56 |
| Sep 1, 1981 | 8.36 |
| Jul 22, 2017 | 8.34 |
| Jul 24, 2010 | 8.1 |
| Jun 1, 1978 | 7.99 |
| Feb 20, 1994 | 7.93 |
| Apr 11, 2008 | 7.66 |
Data provided by the National Weather Service.