Duck Creek (WI) at Howard
Critical Stages
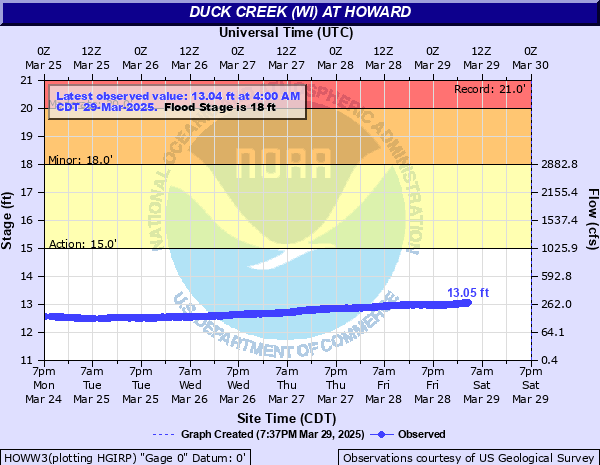
15' - Action
18' - Flood
20' - Moderate
23' - Major
Latest Observation
Updated: 7:00 AM CST 12/5/25
Status: No Flooding
Stage: 11.25 ft
Flow: 0.0069 kcfs
Forecast
Forecast not available for this location.
| Time | Stage (ft) | Flow (kcfs) |
|---|---|---|
| 7:00 AM 12/5 | 11.25 | 0.0069 |
| 6:45 AM 12/5 | 11.26 | 0.0071 |
| 6:30 AM 12/5 | 11.26 | 0.0071 |
| 6:15 AM 12/5 | 11.26 | 0.0071 |
| 6:00 AM 12/5 | 11.26 | 0.0071 |
| 5:45 AM 12/5 | 11.26 | 0.0071 |
| 5:30 AM 12/5 | 11.26 | 0.0071 |
| 5:15 AM 12/5 | 11.26 | 0.0071 |
| 5:00 AM 12/5 | 11.26 | 0.0071 |
| 4:45 AM 12/5 | 11.26 | 0.0071 |
| 4:30 AM 12/5 | 11.27 | 0.0073 |
| 4:15 AM 12/5 | 11.27 | 0.0073 |
| 4:00 AM 12/5 | 11.27 | 0.0073 |
| 3:45 AM 12/5 | 11.27 | 0.0073 |
| 3:30 AM 12/5 | 11.27 | 0.0073 |
| 3:15 AM 12/5 | 11.27 | 0.0073 |
| 3:00 AM 12/5 | 11.26 | 0.0071 |
| 2:45 AM 12/5 | 11.26 | 0.0071 |
| 2:30 AM 12/5 | 11.26 | 0.0071 |
| 2:15 AM 12/5 | 11.26 | 0.0071 |
| 2:00 AM 12/5 | 11.25 | 0.0069 |
| 1:45 AM 12/5 | 11.25 | 0.0069 |
| 1:30 AM 12/5 | 11.25 | 0.0069 |
| 1:15 AM 12/5 | 11.25 | 0.0069 |
| 1:00 AM 12/5 | 11.24 | 0.0067 |
| 12:45 AM 12/5 | 11.24 | 0.0067 |
| 12:30 AM 12/5 | 11.24 | 0.0067 |
| 12:15 AM 12/5 | 11.23 | 0.0065 |
| 12:00 AM 12/5 | 11.23 | 0.0065 |
| 11:45 PM 12/4 | 11.23 | 0.0065 |
24' -
Water touches the bottom of the Highway FF bridge. Water may be surrounding structures in Howard. Pamperin Park is covered with up to 6 feet of water.
21.5' -
Water levels are covering much of Pamperin Park. Flooding affects may include low lying areas in Howard.
19.5' -
Widespread lowland flooding may be occurring downstream of the highway FF bridge, which includes Pamperin Park.
19.5' -
An ice jam may be occurring along the Highway FF bridge. Lowland flooding may be occurring downstream which includes portions of Pamperin Park.
18' -
there is widespread lowland flooding.
18' -
An ice jam may be producing a buildup of ice and water in low lying areas.
15' -
There is minor flooding of lowland and agricultural land.
| Date | Stage (ft) |
|---|---|
| Jun 23, 1990 | 21 |
| Apr 25, 1994 | 19.76 |
| Mar 12, 2010 | 18.77 |
| Mar 28, 2005 | 18.73 |
| Apr 2, 2013 | 18.73 |
| Apr 2, 2023 | 18.29 |
| Jul 6, 1993 | 18.02 |
| Dec 15, 2015 | 18.01 |
| Mar 15, 1996 | 17.73 |
| Apr 12, 2008 | 17.4 |
| Mar 3, 2004 | 17.4 |
| Mar 29, 1998 | 17.32 |
| Apr 12, 2008 | 17.24 |
| Mar 29, 1997 | 17.07 |
| Mar 9, 1992 | 16.75 |
| Apr 15, 1991 | 16.49 |
| Mar 13, 1995 | 15.41 |
| Apr 1, 2022 | 15.14 |
| Jun 4, 2002 | 15 |
Data provided by the National Weather Service.