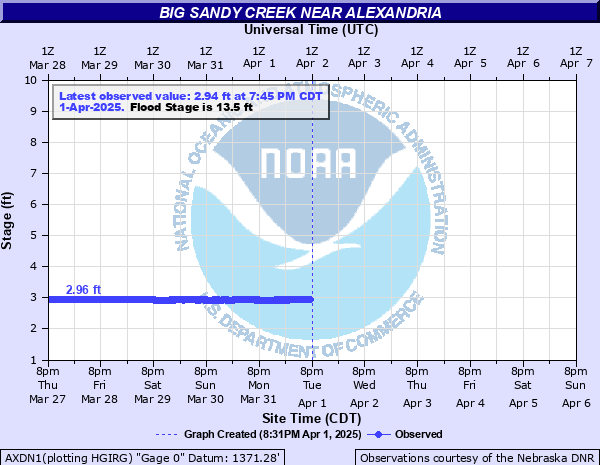
Big Sandy Creek near Alexandria
Critical Stages
11.5' - Action
13.5' - Flood
14.5' - Moderate
15.5' - Major
Latest Observation
Updated: 12:45 AM CST 12/16/25
Status: No Flooding
Stage: 2.91 ft
Flow: -999 kcfs
Forecast
Forecast not available for this location.
| Time | Stage (ft) | Flow (kcfs) |
|---|---|---|
| 12:45 AM 12/16 | 2.91 | -999 |
| 12:30 AM 12/16 | 2.91 | -999 |
| 12:15 AM 12/16 | 2.9 | -999 |
| 12:00 AM 12/16 | 2.9 | -999 |
| 11:45 PM 12/15 | 2.91 | -999 |
| 11:30 PM 12/15 | 2.91 | -999 |
| 11:15 PM 12/15 | 2.91 | -999 |
| 11:00 PM 12/15 | 2.9 | -999 |
| 10:45 PM 12/15 | 2.91 | -999 |
| 10:30 PM 12/15 | 2.91 | -999 |
| 10:15 PM 12/15 | 2.91 | -999 |
| 10:00 PM 12/15 | 2.91 | -999 |
| 9:45 PM 12/15 | 2.91 | -999 |
| 9:30 PM 12/15 | 2.91 | -999 |
| 9:15 PM 12/15 | 2.91 | -999 |
| 9:00 PM 12/15 | 2.91 | -999 |
| 8:45 PM 12/15 | 2.91 | -999 |
| 8:30 PM 12/15 | 2.91 | -999 |
| 8:15 PM 12/15 | 2.91 | -999 |
| 8:00 PM 12/15 | 2.91 | -999 |
| 7:45 PM 12/15 | 2.91 | -999 |
| 7:30 PM 12/15 | 2.91 | -999 |
| 7:15 PM 12/15 | 2.91 | -999 |
| 7:00 PM 12/15 | 2.91 | -999 |
| 6:45 PM 12/15 | 2.91 | -999 |
| 6:30 PM 12/15 | 2.91 | -999 |
| 6:15 PM 12/15 | 2.91 | -999 |
| 6:00 PM 12/15 | 2.92 | -999 |
| 5:45 PM 12/15 | 2.92 | -999 |
| 5:30 PM 12/15 | 2.92 | -999 |
17' -
The bridge at the gage site will overtop.
15.5' -
Major flooding is ongoing primarily impacting Alexandria along the southern part of town. In addition, Highway 53 may flood.
15' -
Floodwaters begin to impact the bottom of the bridge at the gage site.
13.5' -
Far southern portions of Alexandria, near the railroad, may begin to flood. In addition, gravel roads along the creek begin to be impacted as widespread lowland flooding is ongoing.
11.5' -
Lowland flooding begins.
| Date | Stage (ft) |
|---|---|
| May 7, 2015 | 17.08 |
| Jun 13, 1984 | 16.71 |
| Jul 25, 1992 | 15.98 |
| Aug 1, 2007 | 15.8 |
| Sep 29, 1983 | 15.37 |
| Jul 2, 1982 | 14.47 |
| Mar 24, 1987 | 14.3 |
| Jun 23, 2003 | 14.27 |
| Oct 11, 1986 | 14.24 |
| Jun 5, 2008 | 13.84 |
| Jun 25, 1997 | 13.5 |
| Oct 2, 2019 | 13.44 |
| May 20, 2011 | 13.03 |
| May 28, 2016 | 12.82 |
| Jul 26, 1993 | 12.8 |
| May 27, 1996 | 12.75 |
| Jun 25, 1996 | 12.75 |
| Jun 15, 2004 | 12.31 |
| Jun 28, 2020 | 12.3 |
| Jun 15, 1990 | 11.94 |
Data provided by the National Weather Service.