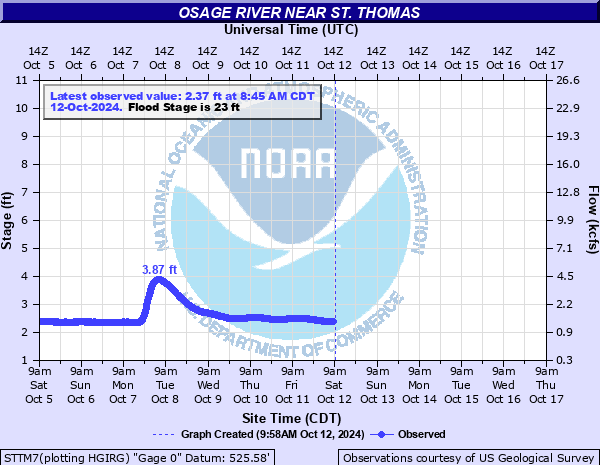
Osage River near St. Thomas
Critical Stages
16' - Action
23' - Flood
30' - Moderate
35' - Major
Latest Observation
Updated: 8:45 AM CST 12/6/25
Status: No Flooding
Stage: 2.54 ft
Flow: 0.968 kcfs
Forecast
Forecast not available for this location.
| Time | Stage (ft) | Flow (kcfs) |
|---|---|---|
| 8:45 AM 12/6 | 2.54 | 0.968 |
| 8:30 AM 12/6 | 2.54 | 0.968 |
| 8:15 AM 12/6 | 2.54 | 0.968 |
| 8:00 AM 12/6 | 2.54 | 0.968 |
| 7:45 AM 12/6 | 2.53 | 0.953 |
| 7:30 AM 12/6 | 2.53 | 0.953 |
| 7:15 AM 12/6 | 2.53 | 0.953 |
| 7:00 AM 12/6 | 2.53 | 0.953 |
| 6:45 AM 12/6 | 2.53 | 0.953 |
| 6:30 AM 12/6 | 2.53 | 0.953 |
| 6:15 AM 12/6 | 2.53 | 0.953 |
| 6:00 AM 12/6 | 2.53 | 0.953 |
| 5:45 AM 12/6 | 2.53 | 0.953 |
| 5:30 AM 12/6 | 2.53 | 0.953 |
| 5:15 AM 12/6 | 2.53 | 0.953 |
| 5:00 AM 12/6 | 2.53 | 0.953 |
| 4:45 AM 12/6 | 2.52 | 0.939 |
| 4:30 AM 12/6 | 2.52 | 0.939 |
| 4:15 AM 12/6 | 2.52 | 0.939 |
| 4:00 AM 12/6 | 2.52 | 0.939 |
| 3:45 AM 12/6 | 2.52 | 0.939 |
| 3:30 AM 12/6 | 2.52 | 0.939 |
| 3:15 AM 12/6 | 2.52 | 0.939 |
| 3:00 AM 12/6 | 2.51 | 0.924 |
| 2:45 AM 12/6 | 2.51 | 0.924 |
| 2:30 AM 12/6 | 2.51 | 0.924 |
| 2:15 AM 12/6 | 2.51 | 0.924 |
| 2:00 AM 12/6 | 2.51 | 0.924 |
| 1:45 AM 12/6 | 2.51 | 0.924 |
| 1:30 AM 12/6 | 2.5 | 0.91 |
34.7' -
Additional residences along Spring Beauty Lane become threatened near this height.
32.7' -
Residence near end of Spring Beauty Lane begins flooding near this height.
31.7' -
Second residence along Old Ferry Road upstream of Route B bridge begins flooding near this height.
28.4' -
Lowest residence at the end of Spring Beauty Lane begins flooding near this height.
26.6' -
Lowest house on Old Ferry Road upstream of the bridge begins flooding near this height.
23' -
Near this height, Route W in Cole County will be closed in both directions.
20.5' -
At least two farm houses become cut off by the rising water near the mouth of Profits Creek.
17' -
At least 5 acres of farmland are flooded near the mouth of Profits Creek downstream of the gauge.
16.5' -
Water begins flooding the bank near Profits Creek mouth downstream of the gauge.
| Date | Stage (ft) |
|---|---|
| Dec 29, 2015 | 29.53 |
| May 1, 2017 | 25.45 |
| Aug 8, 2013 | 25.04 |
| Jul 3, 2015 | 23.95 |
| Jan 6, 2005 | 23.37 |
| May 4, 2017 | 23.13 |
| Jun 26, 1998 | 21.86 |
| Apr 1, 2008 | 20.99 |
| Jun 17, 2009 | 20.94 |
| Oct 6, 1998 | 19.78 |
| May 21, 2011 | 18.82 |
| Apr 21, 2010 | 18.14 |
| May 13, 2002 | 17.73 |
| Jul 19, 2007 | 17.08 |
| Jun 6, 2001 | 16.34 |
| Feb 27, 1997 | 15.94 |
| May 27, 2004 | 14.53 |
| Jun 11, 2003 | 14.18 |
| Jun 29, 2000 | 12.06 |
| May 5, 2006 | 11.46 |
Data provided by the National Weather Service.